page
Provisional data only
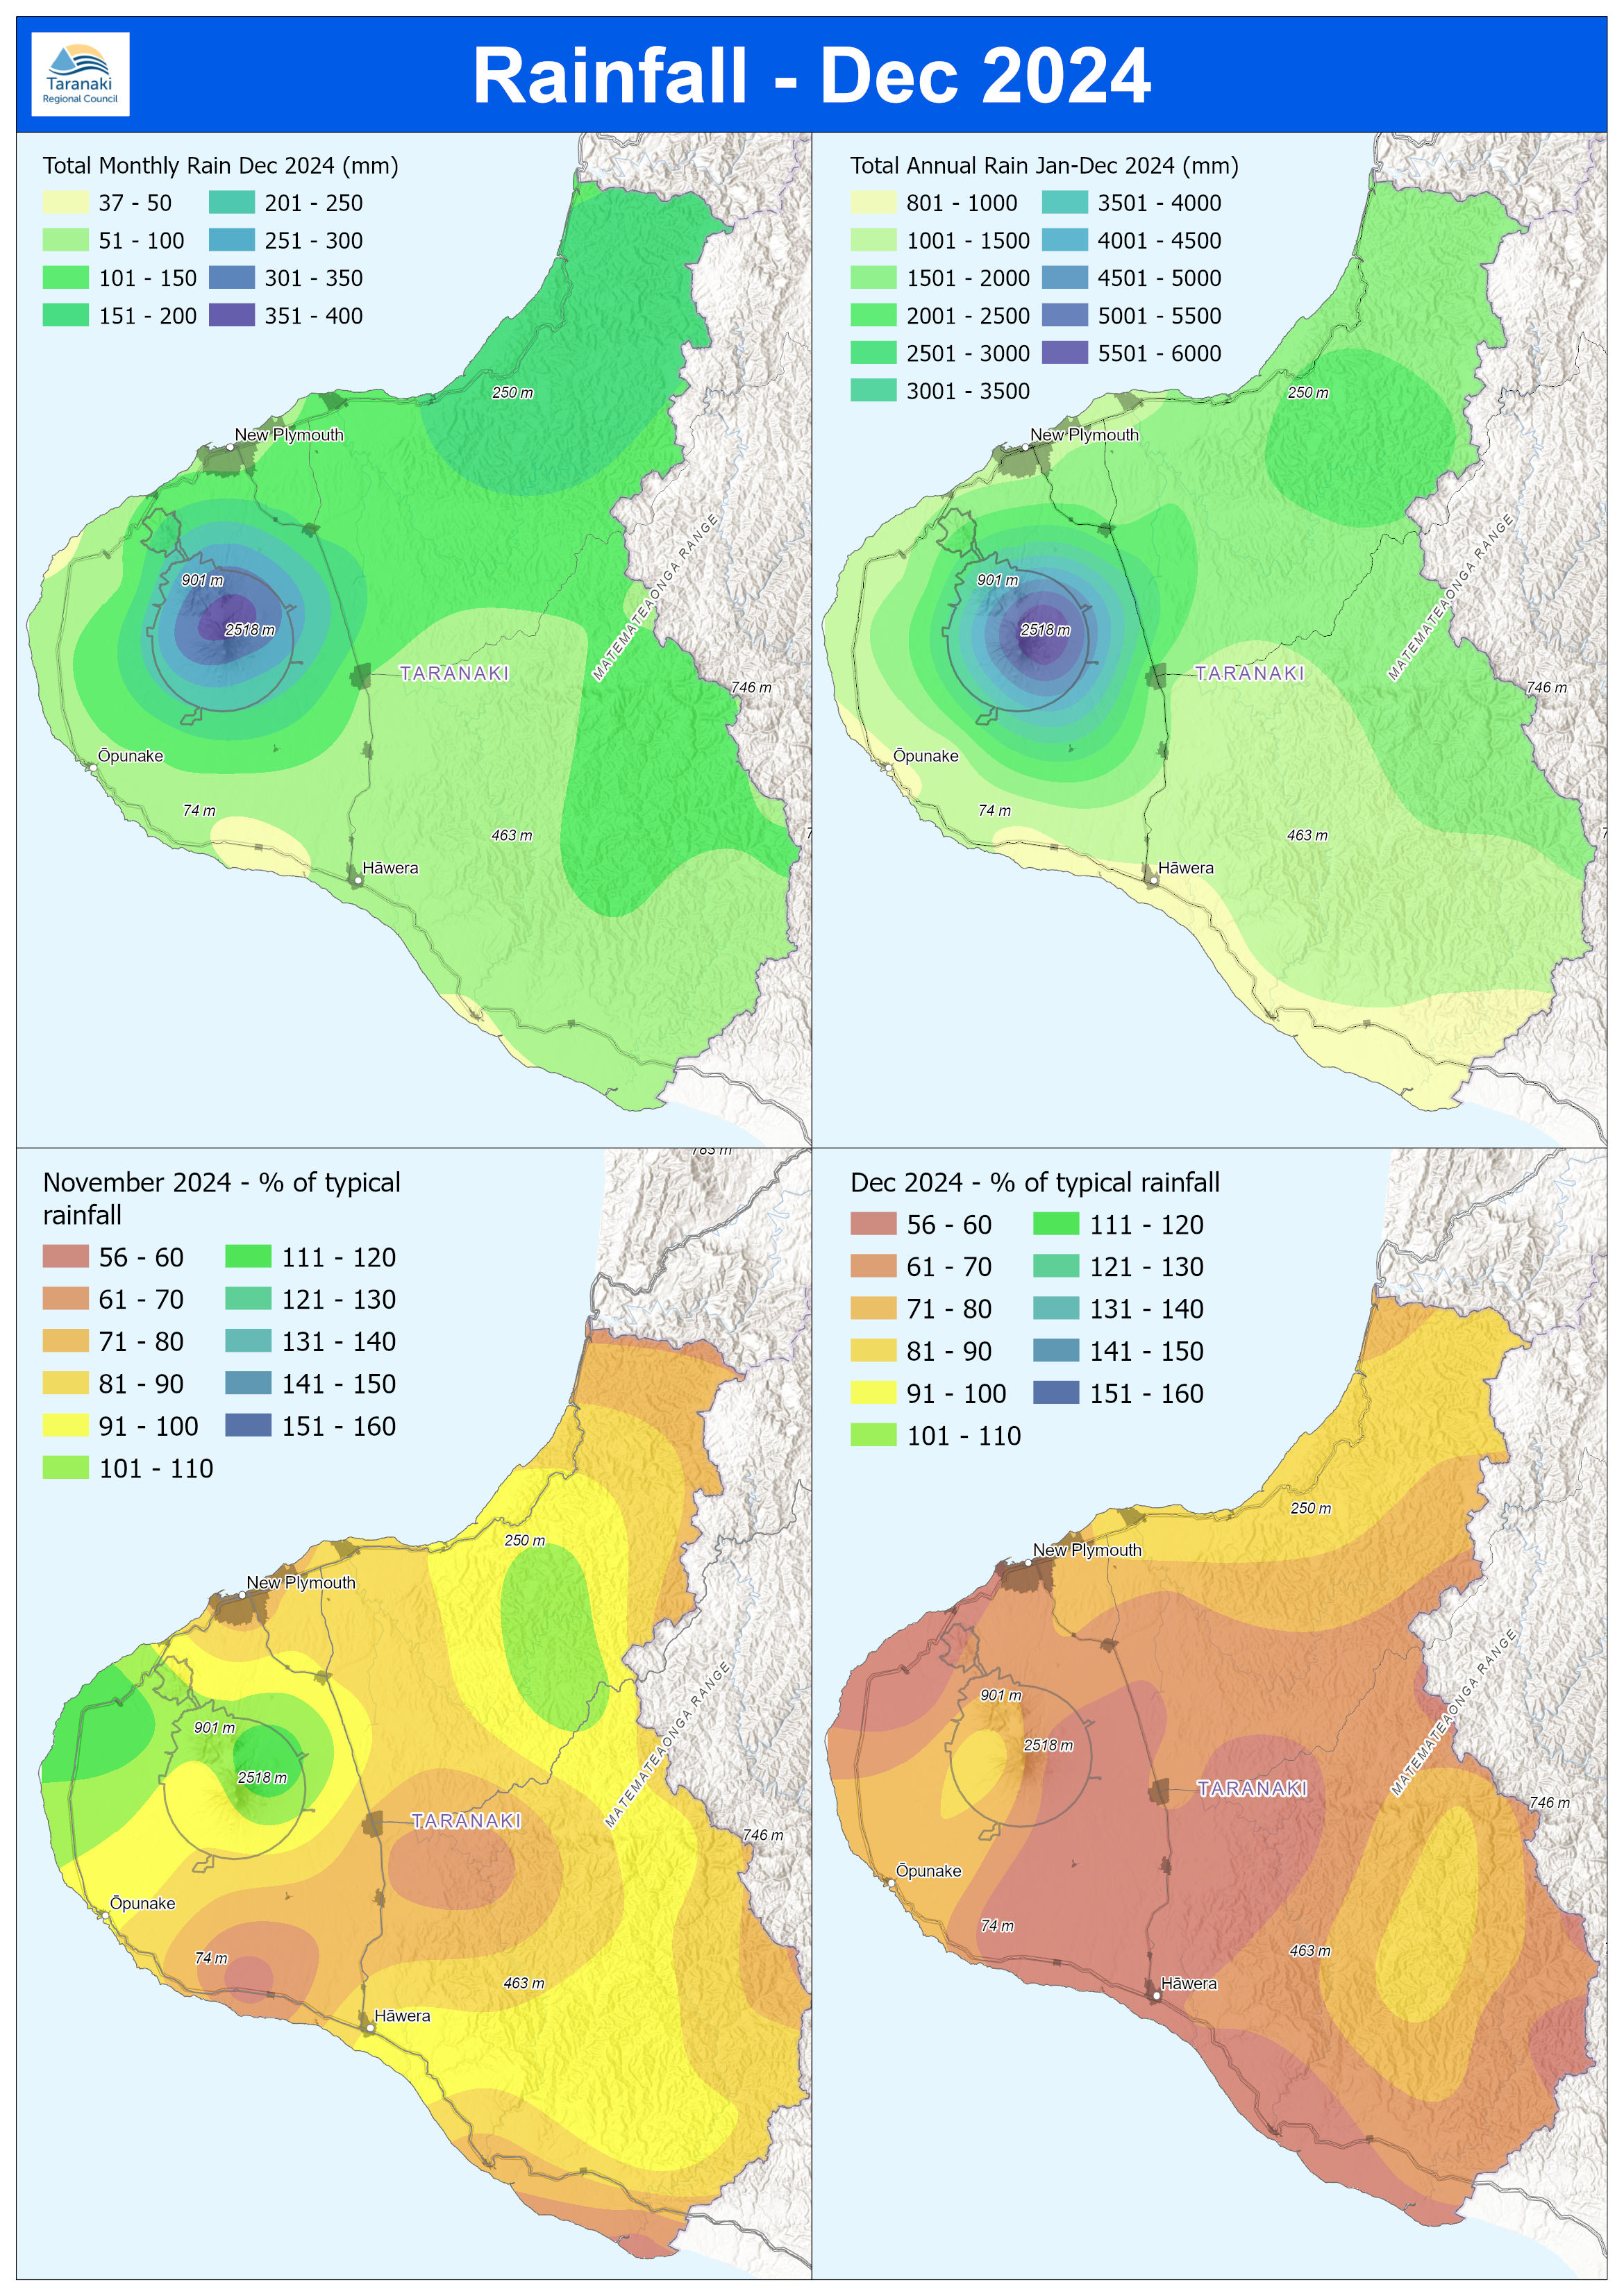
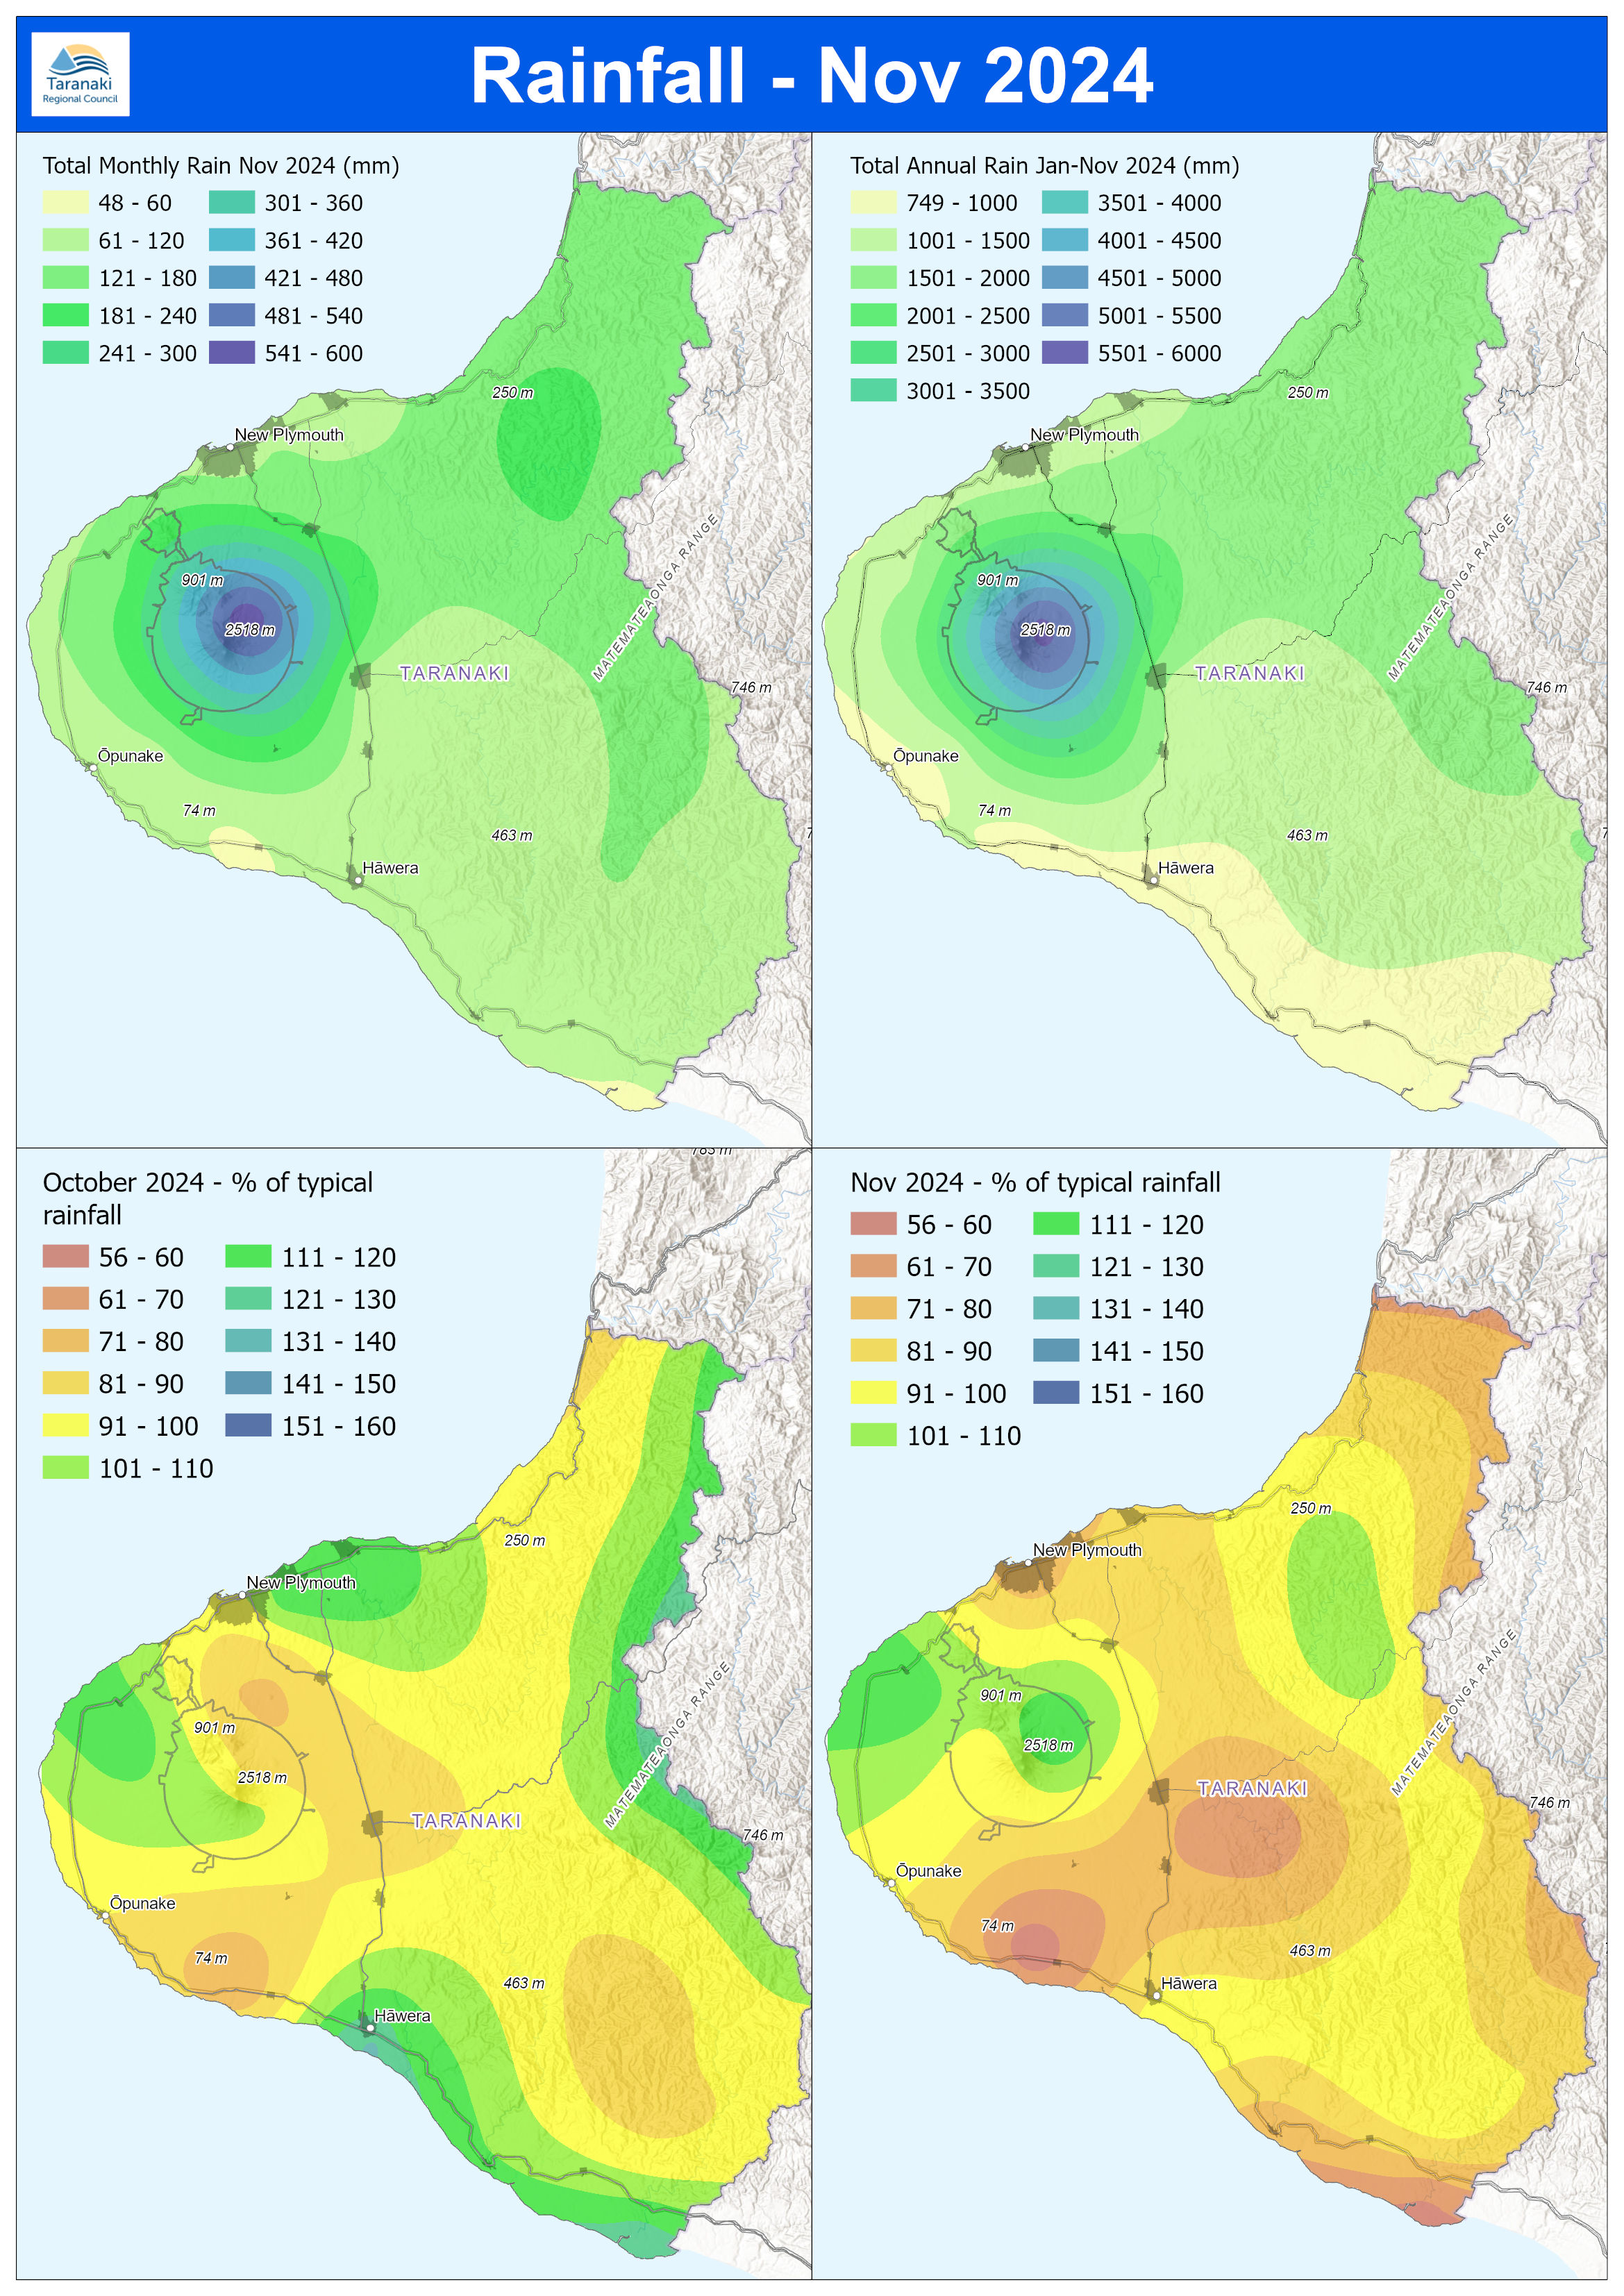
Total monthly rainfall (mm)
xxx yy%
KEY
% of average rainfallmonthly
xxx yy %
NEW
PLYMOUTH
H WERAĀ
ŌPUNAKE
ELTHAM
Kaka Rd
P teaā
K tareō
Motunui
Brooklands
Inglewood
Pohokura
SaddleNorth Egmont
Stratford
Huinga
Cape Egmont
Dawson Falls
Glenn Rd
Whareroa
Rimunui
May 420 Rainfall2
39%83
54%110
68%111
46%83
52%122
45%83
53%357
55%123
59%96
75%100
67%423
89%104
6
swimming. Can you see your feet in water that's knee-deep? If not, it's best to swim when the water clears. Toxic algae Potentially toxic algae are naturally occurring and live in a range of waterways. During the summer months, when rainfall is low toxic algae can start to bloom and produce toxins. These natural toxins, known as cyanotoxins, can be a threat to humans and animals when eaten, even licked, or when water containing the toxins is swallowed. Potentially toxic algae differ from harmless bright
page
Taranaki Regional Council Monthly Rainfall and Environmental
Data Report for August 2025
Note: The data presented here is provisional data only and may change as a result of quality control at a later date.
1. Rainfall
Map 1: August total rainfall (mm) and percentage of long-term mean (colour key).
page
Map 1a. Total rainfall 1 January to end August (mm) and percentage of long-term mean (colour key).
page
Table 1: Rainfall