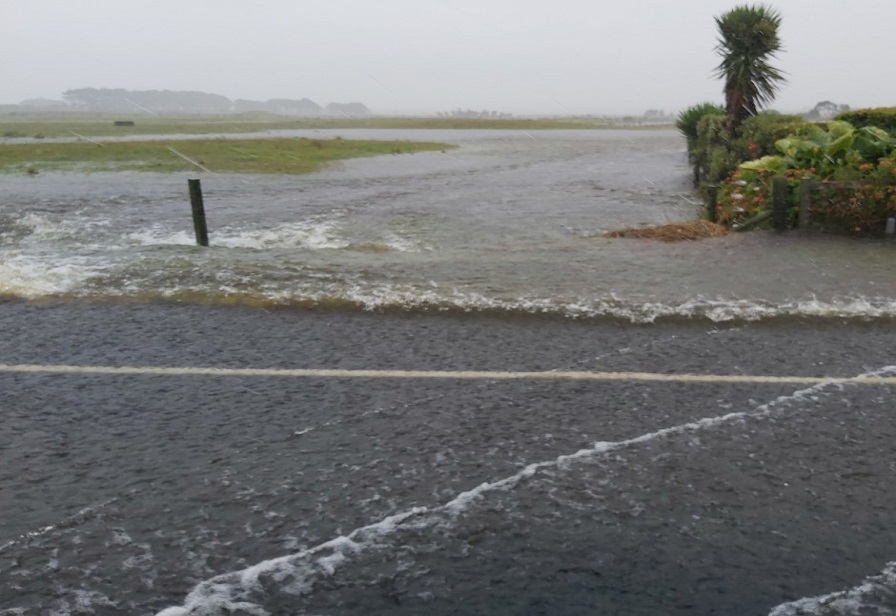
With two weekends of significant rainfall, a number of records were set in February.

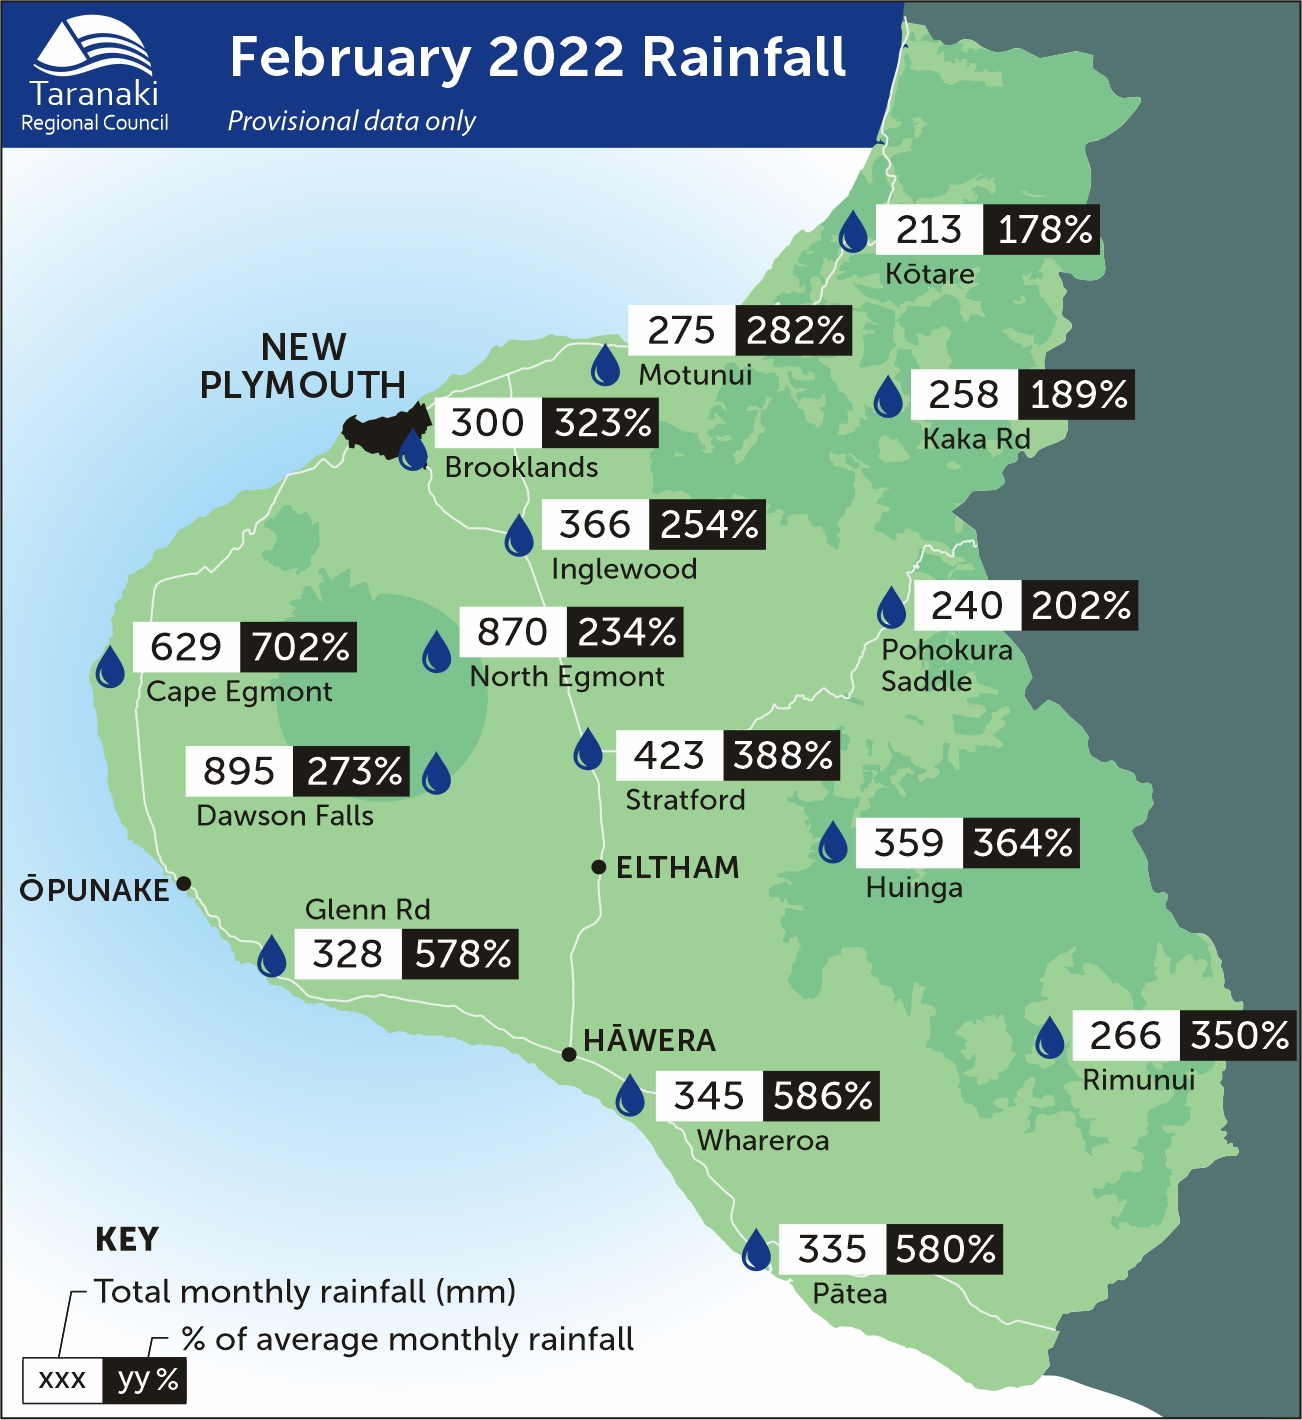
Rainfall for February was extremely high with sites recording between 178% and 702% of normal, with an average of 354%.
This rainfall really only occurred on a handful of days, the 5th to 7th and then a week later from the 11th to 13th. The rainfall site at Cape Egmont recorded 628.6mm for the month, which is the highest February rainfall recorded for the site since records began in 1930.
Summer rainfall (December to February) ranged between 100% and 324% of normal, with an average of 199%. This was largely due to December and February recording well above normal rainfall, while January recorded well below normal.
February 2022 rainfall maps
February 2022 rainfall maps [PDF, 736 KB]
What you should know:
-
The site maps show data from a selection of the sites we monitor, but not all of them.
-
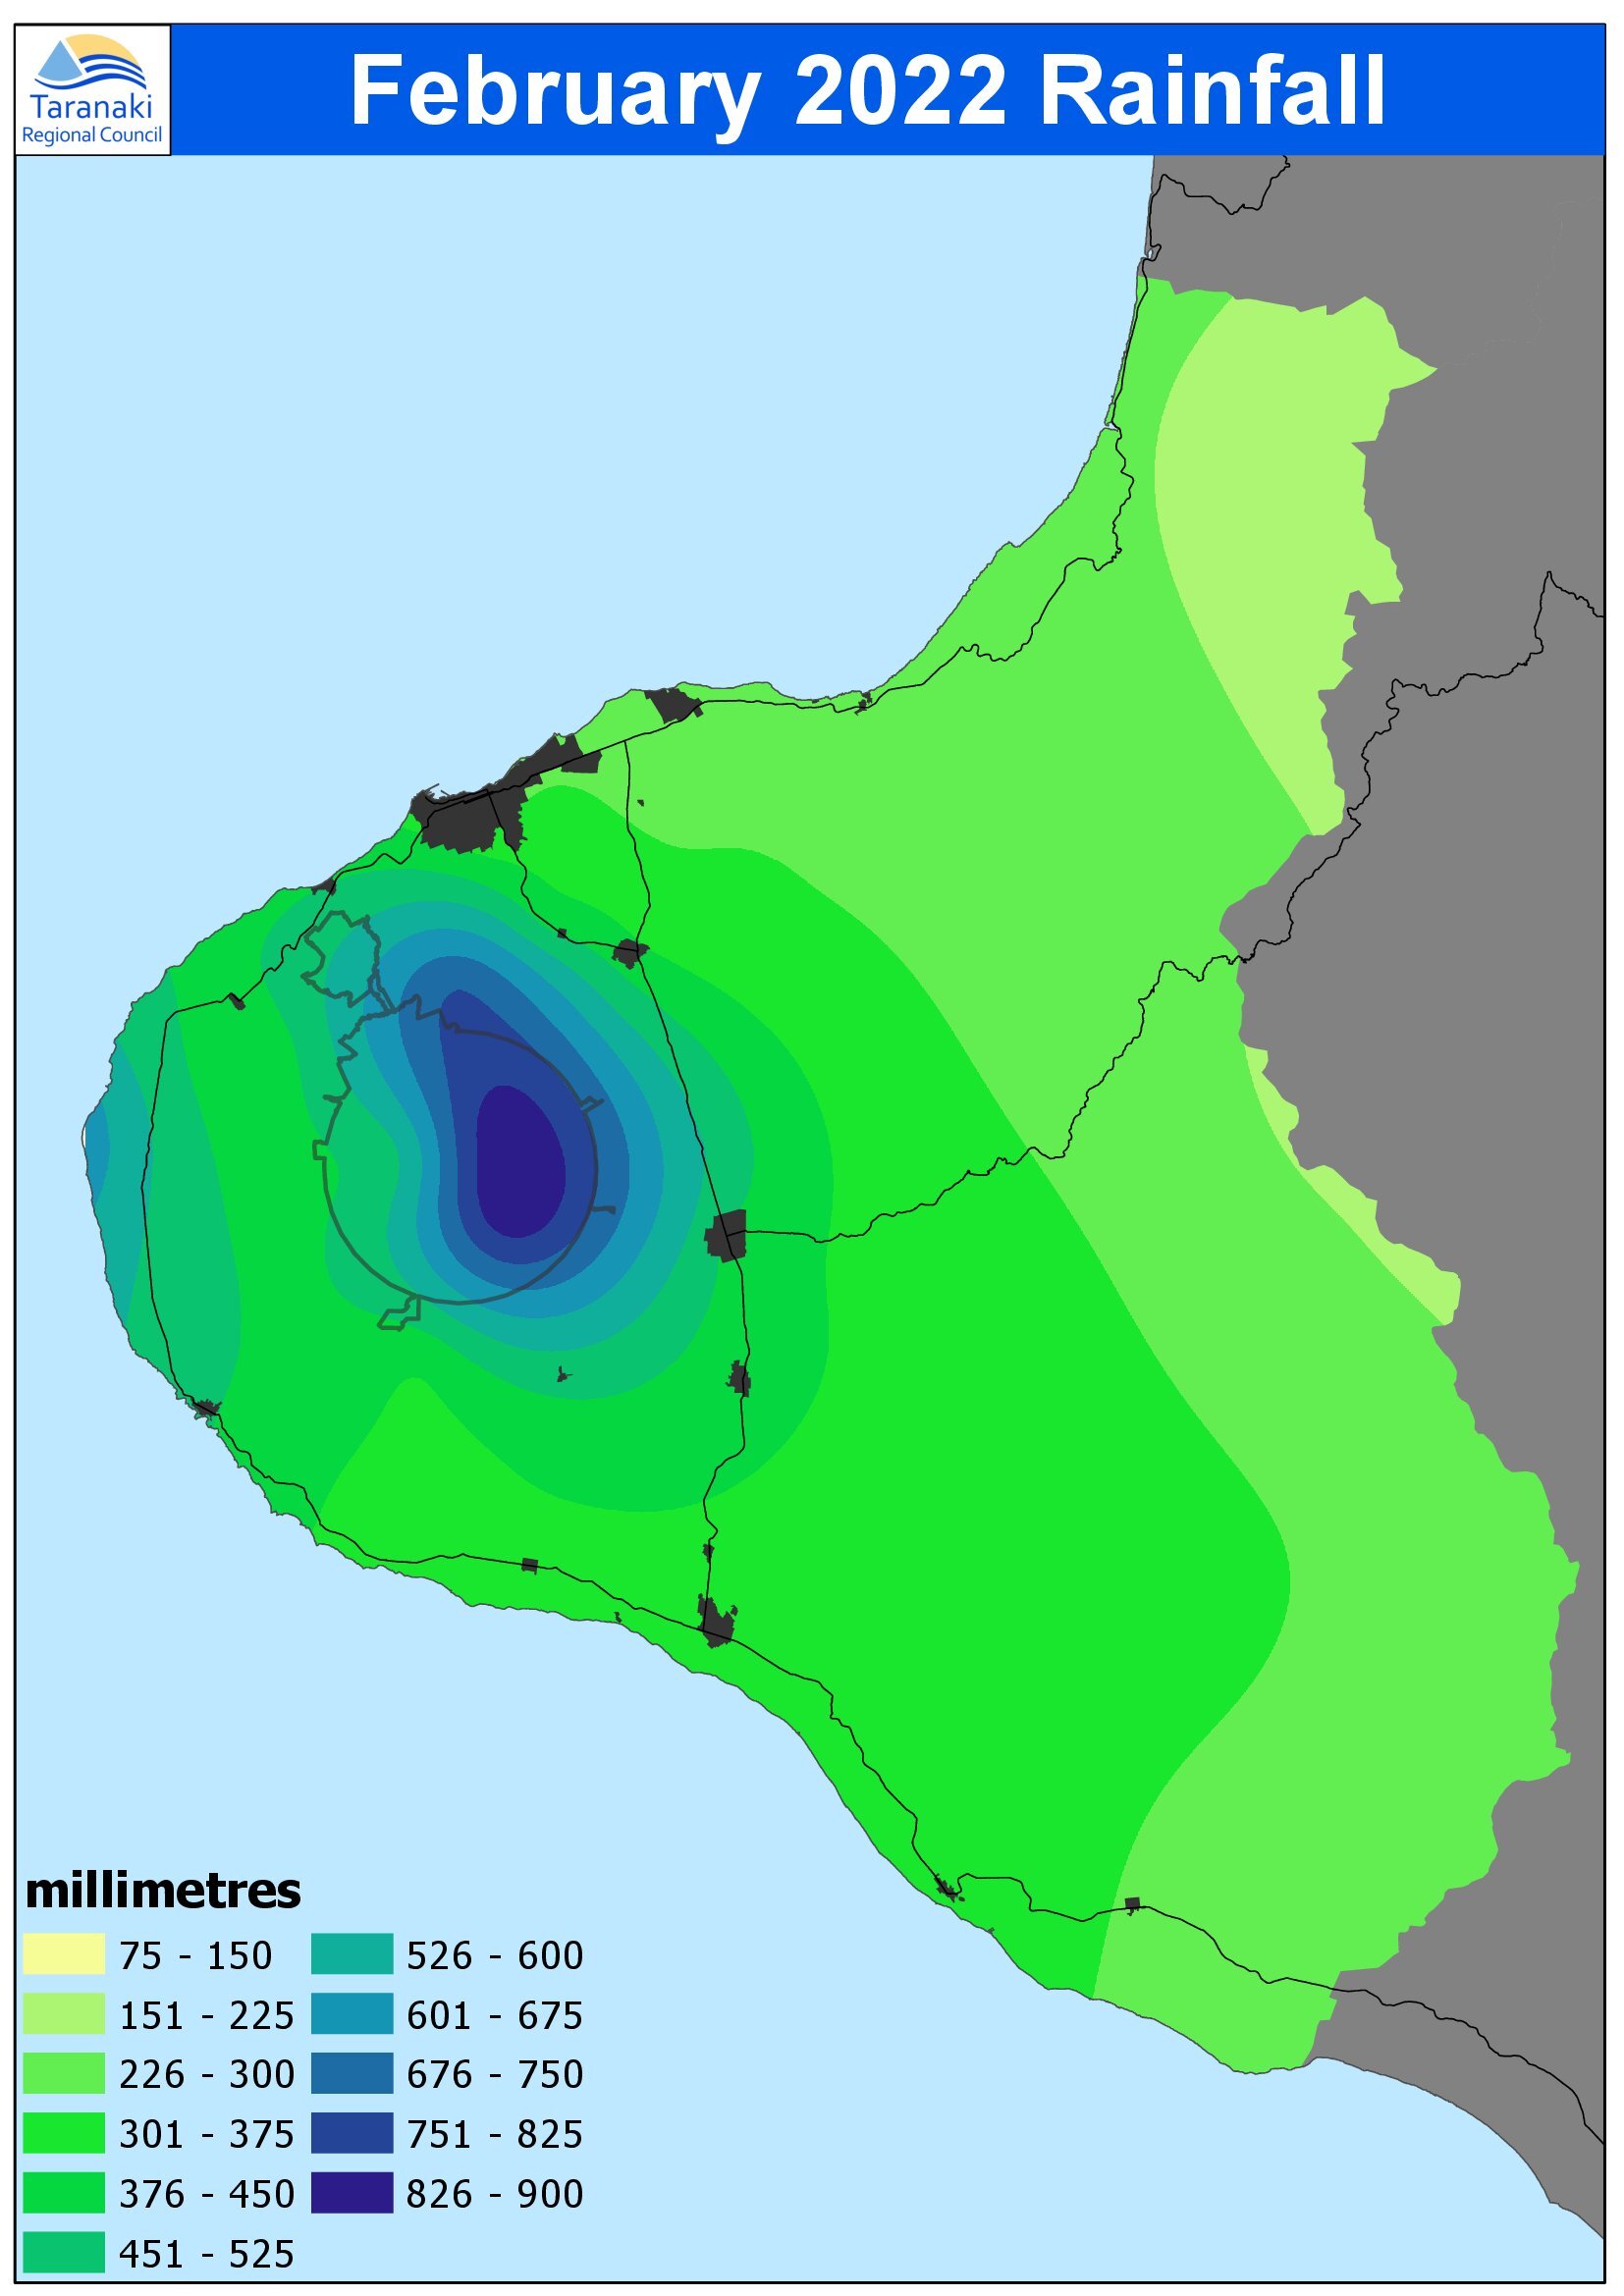
The distribution maps are based on mathematical modelling and may not accurately represent actual rainfall in some unmonitored areas.
Click on each map for larger version.
MONITORED SITES

RAINFALL DISTRIBUTION
