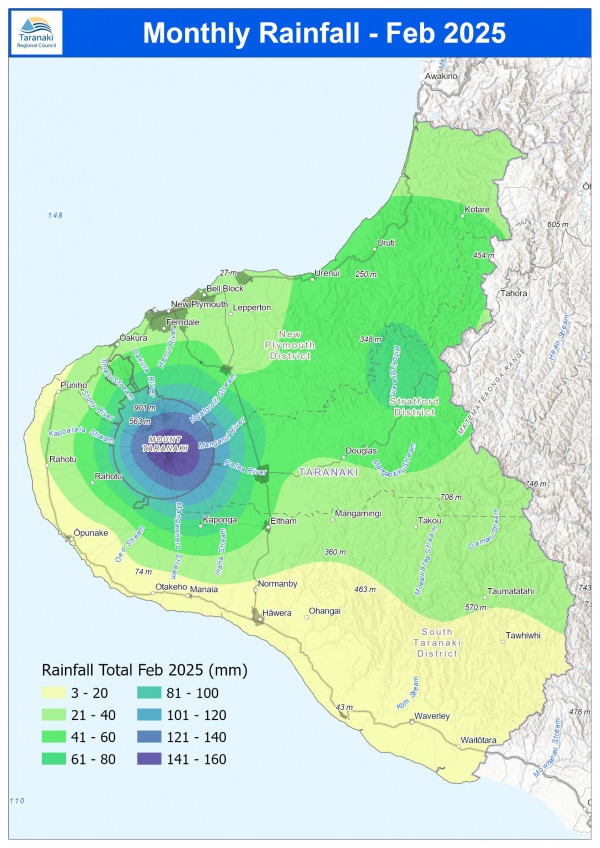
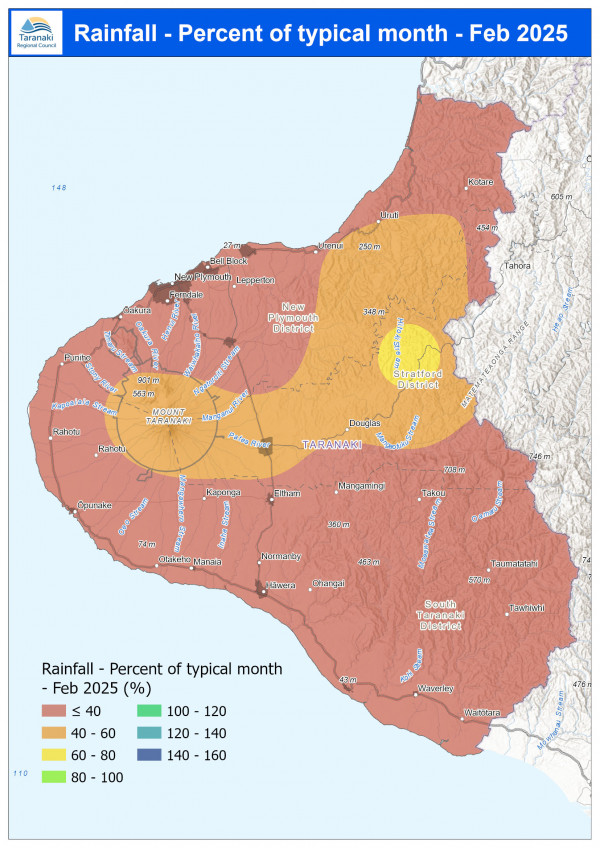
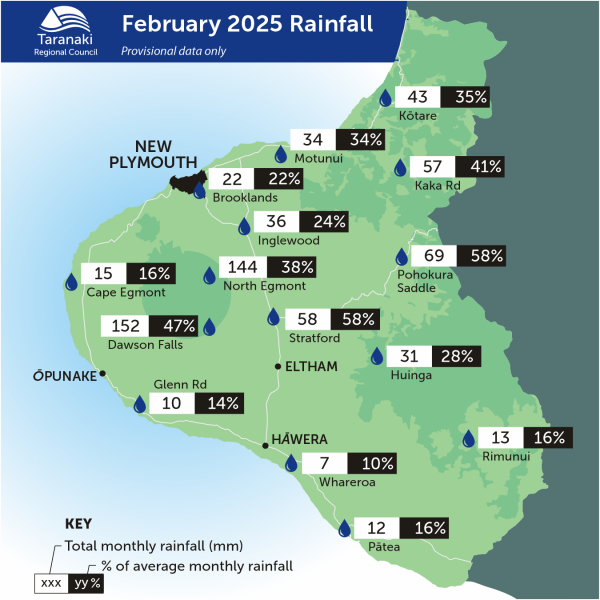
February only had an average of 60.8mm of rainfall – 75% less than usual.
This ranged from 97% less than normal at Waitōtara at Hawken Rd, and 42% less at Pohokura Saddle.
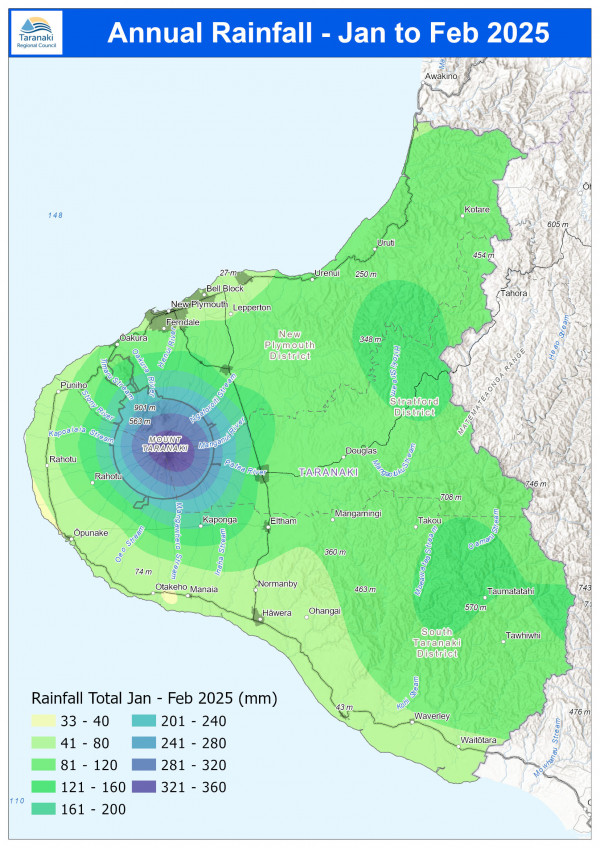
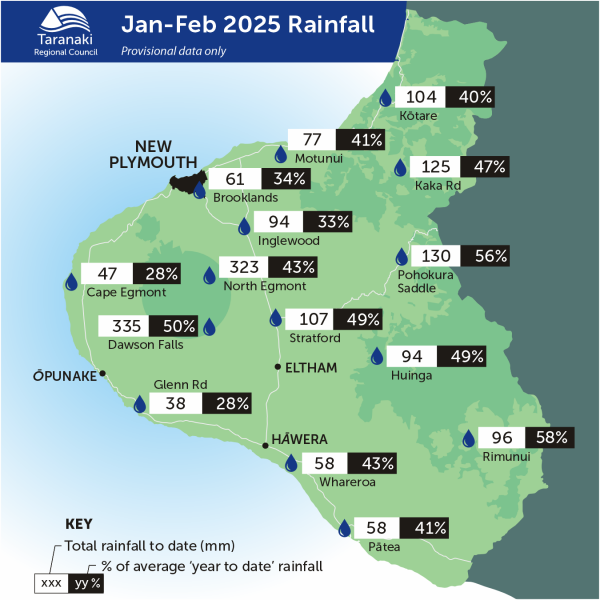
Year to date rainfall is lowest at Kaupokonui at Glenn Rd with 72% less rainfall than normal, Omahine at Moana Trig has had the highest year-to-date rainfall with 33% less than normal, on average there has been 57% less than normal across all rain gauges.
Mean river flows for February were 42.7% lower than typical values, low flows were 8.1% lower, and high flows 82.6% lower than typical values while mean river (non-mountain) water temperatures were 19°C, an average of 0.9°C warmer than long-term values.
The average air temperature for the region (excluding Te Maunga sites) was 18°C, which is 0.5°C warmer than long-term February averages. The maximum air temperature recorded was 28.8°C at Inglewood at Oxidation Ponds on 7 February.
February average wind speeds were 11.2km/hr, with average gust strength of 35.4km/hr, these were 1.4km/hr lighter, and 1.9km/hr weaker than the long-term average. The maximum wind gust recorded was 76.7km/hr at Waitotara at Ngutuwera on 21 February.
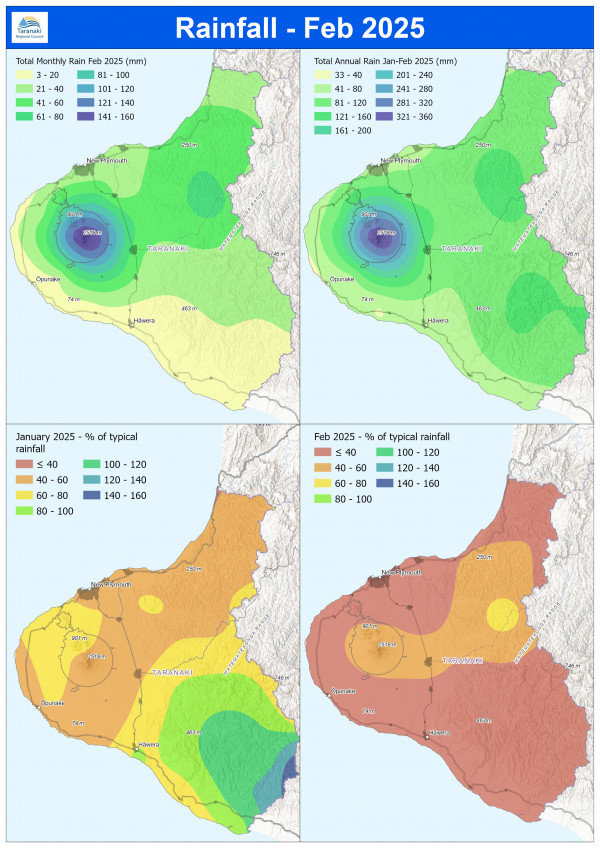
February 2025 rainfall maps
What you should know:
- The site maps show data from a selection of the sites we monitor, but not all of them.
- The distribution maps are based on mathematical modelling and may not accurately represent actual rainfall in some unmonitored areas.
- This is raw data and may not have been subjected to a quality control process. All efforts are made to ensure the integrity of the data, but the Council cannot guarantee its accuracy, or its suitability for any purpose. See the full terms and conditions for the use of environmental data(external link).
MONITORED SITES
RAINFALL DISTRIBUTION