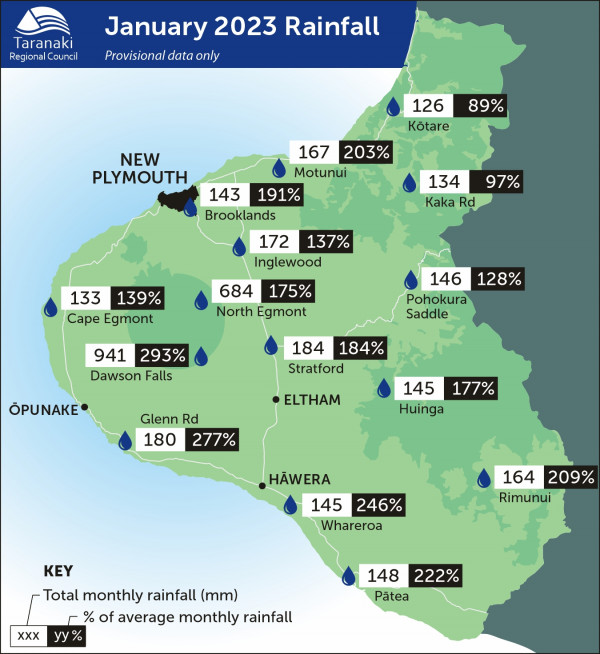
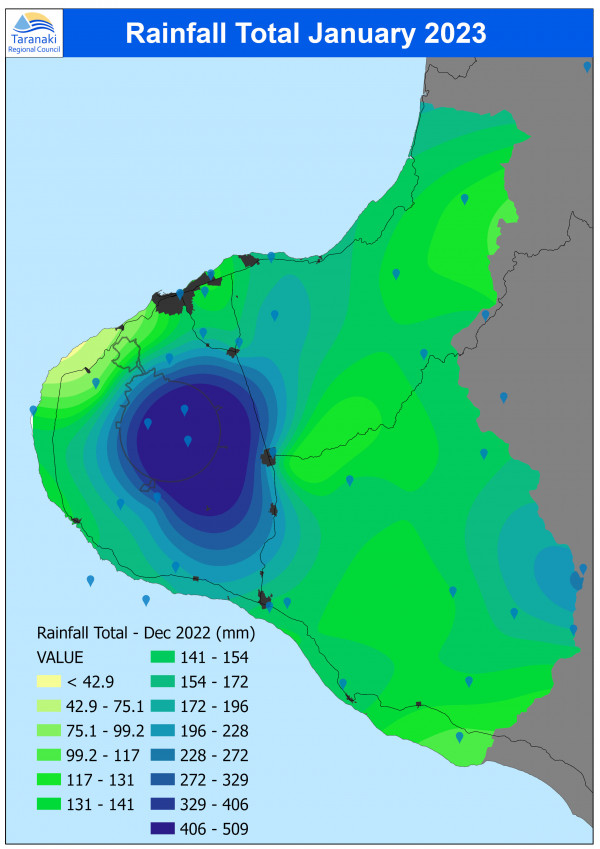
It was a month of contrasts for the weather in Taranaki in January with a couple of weeks of cool, wet and windy conditions followed by dry and warmer weather and ending with huge downpours across the region.

Rainfall was on average 193.5% of the long-term average, ranging from 89% at Kotare at O’Sullivans to 547% at Whanganui at Mataimona Trig. Rainfall was highest in the south-west ring plain area, and in the south and eastern parts of the hill country. Kaupokonui at Glenn Rd has already received 15% of a typical year’s rainfall.
Mean river flows for January were generally above typical averages at around 179.9% while mean river non-mountain water temperatures were 18ºC, an average of -0.5ºC cooler than long-term values. The average air temperature (excluding Te Maunga sites) was 18.4ºC, which is 0.3ºC warmer than usual.
January 2023 rainfall maps
What you should know:
-
The site maps show data from a selection of the sites we monitor, but not all of them.
-
The distribution maps are based on mathematical modelling and may not accurately represent actual rainfall in some unmonitored areas.
Click on each map for larger version.
MONITORED SITES

RAINFALL DISTRIBUTION
