Last month in May, sites received 48% of the typical year's rainfall with 257.2 mm of rain.

On average rainfall for May was 257.2 mm, 48% more typical May rainfall, and ranging from 11% more rainfall at Omahine at Moana Trig, and 86% more rainfall at Tawhiti at Duffys than a typical May.
Year to date rainfall ranges from 11% more rainfall at Waitotara at Hawken Rd, and 78% more rainfall at Whanganui at Mataimona Trig, with an average of 36% more than normal. Compared to typical full year totals, on average sites have already received 48% of a typical years rainfall, with the highest value at Hawera AWS, 57% of normal, whereas Uruti at Kaka Rd sits at 40% of the typical years total.
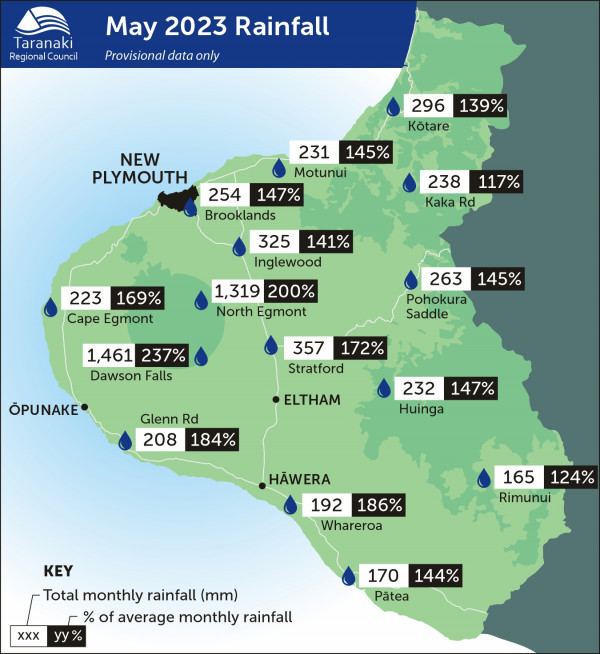
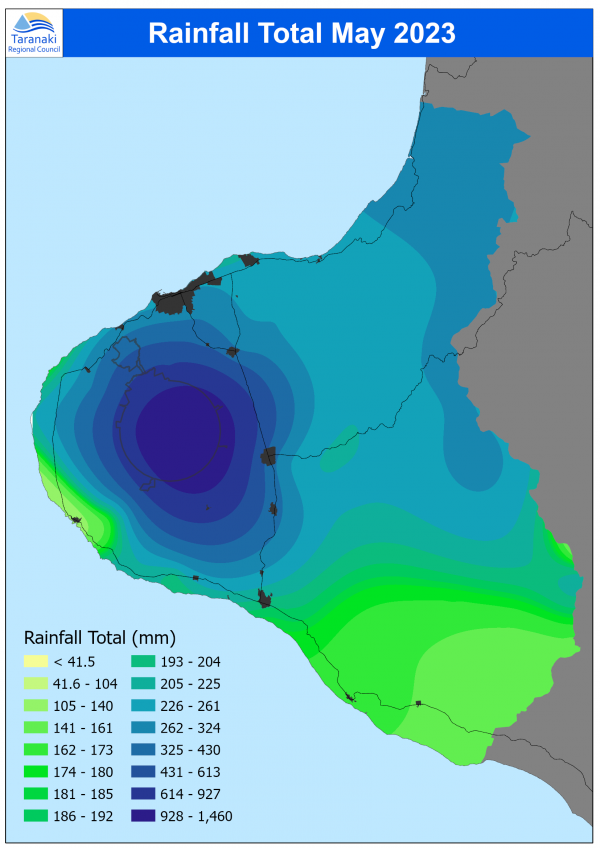
May 2023 rainfall maps
What you should know:
-
The site maps show data from a selection of the sites we monitor, but not all of them.
-
The distribution maps are based on mathematical modelling and may not accurately represent actual rainfall in some unmonitored areas.
Click on each map for larger version.
MONITORED SITES

RAINFALL DISTRIBUTION
