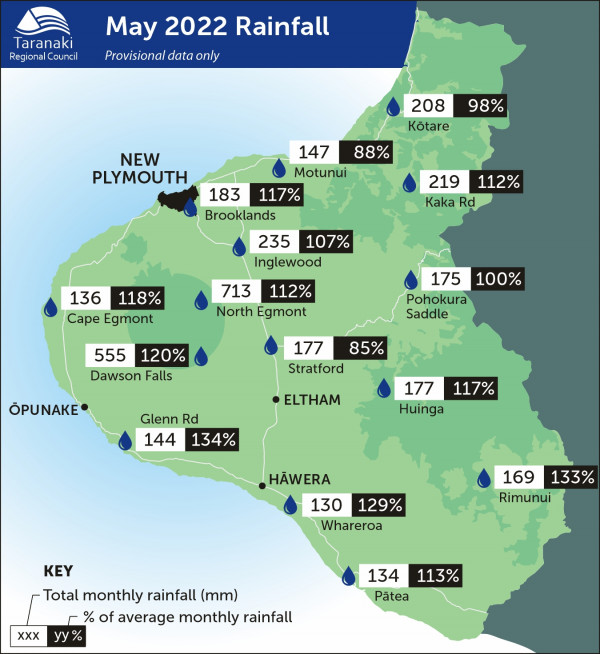
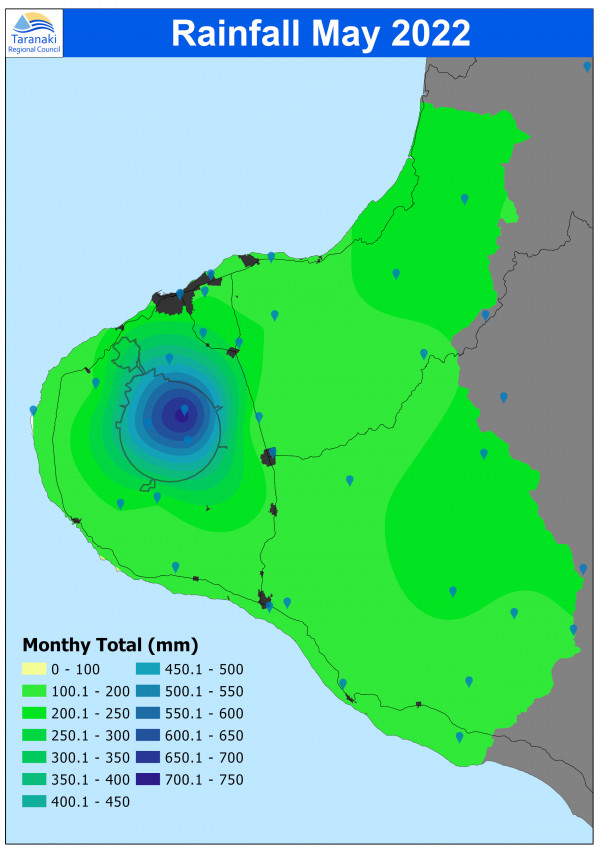
Rainfall for May was generally above the long-term May average, ranging from 85% to 179%, with an average of 118% of normal.

Rainfall was higher around the Maunga and Ring Plain, and in the south of the region. Year to date rainfall is sitting between 75.6% and 213.4% with an average of 121.8% of normal.
Cape Egmont remains at more than 200% of normal to date and has already received 80% of a typical year’s rain in five months.
May 2022 rainfall maps
What you should know:
-
The site maps show data from a selection of the sites we monitor, but not all of them.
-
The distribution maps are based on mathematical modelling and may not accurately represent actual rainfall in some unmonitored areas.
Click on each map for larger version.
MONITORED SITES

RAINFALL DISTRIBUTION
