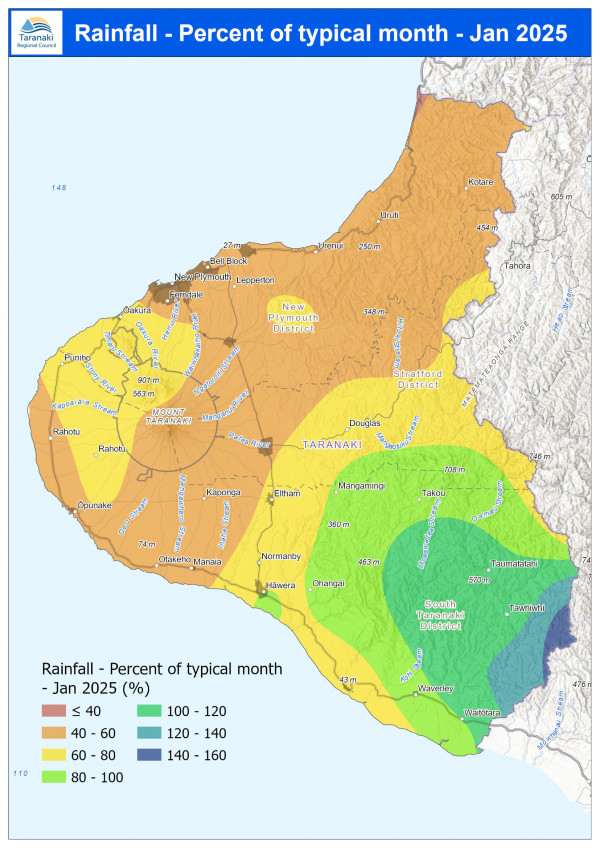
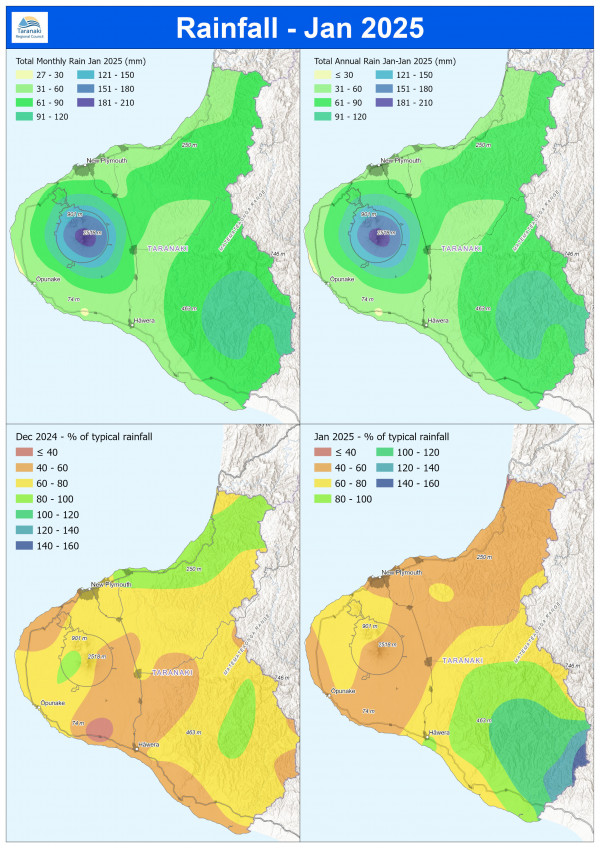
Last year ended with December having 34% less rain than usual and the first month of 2025 mirrored that exactly with 34% less rainfall across the region in January.
This was particularly the case in South Taranaki with the monitoring station at Kaupokonui at Glenn Rd recording 59% less than usual. The district also saw the highest soil temperature with 28.1°C at Waitōtara at Rimunui Station on 22 January.
Mean river flows for January were 40.1% lower than typical values, low flows were 11.6% lower and high flows 66.2% lower than typical values while mean river (non-mountain) water temperatures were 17.6°C, an average of 0.6°C cooler than long-term January values. The maximum river water temperature was 26.3°C at Kapoaiaia at Lighthouse on 24 January.
The maximum river water temperature recorded in January was 26.3°C at Kapoaiaia at Lighthouse on 24 January. The maximum wind gust recorded in January was 72.4km/hr at Waitōtara at Ngutuwera on 12 January.
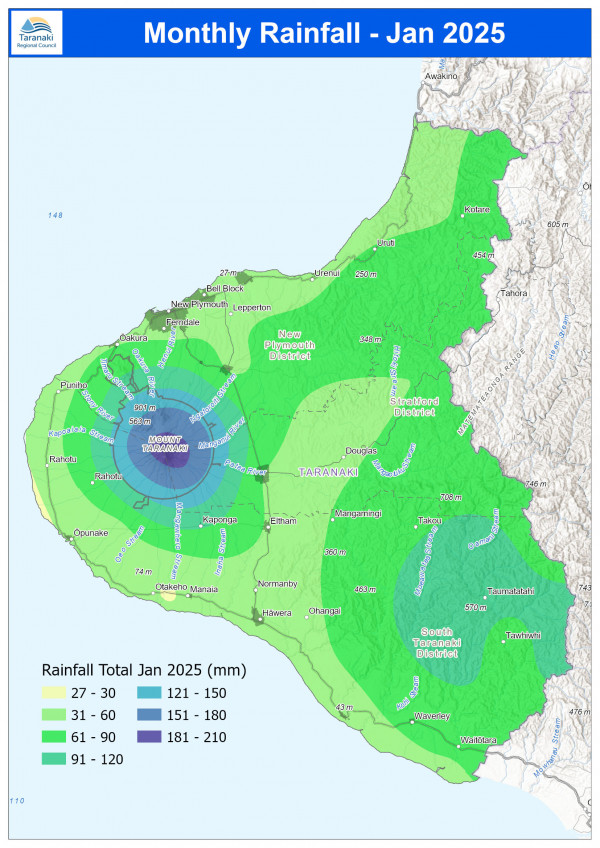
January 2025 rainfall maps
What you should know:
- The site maps show data from a selection of the sites we monitor, but not all of them.
- The distribution maps are based on mathematical modelling and may not accurately represent actual rainfall in some unmonitored areas.
- This is raw data and may not have been subjected to a quality control process. All efforts are made to ensure the integrity of the data, but the Council cannot guarantee its accuracy, or its suitability for any purpose. See the full terms and conditions for the use of environmental data(external link).
MONITORED SITES

RAINFALL DISTRIBUTION