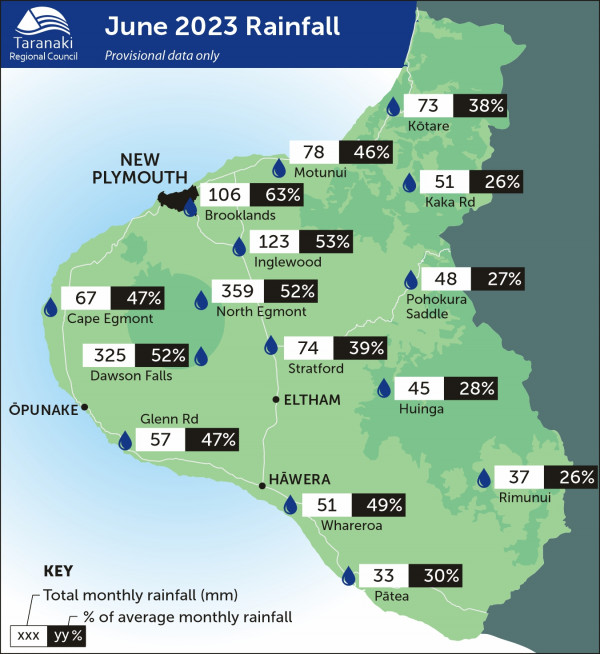
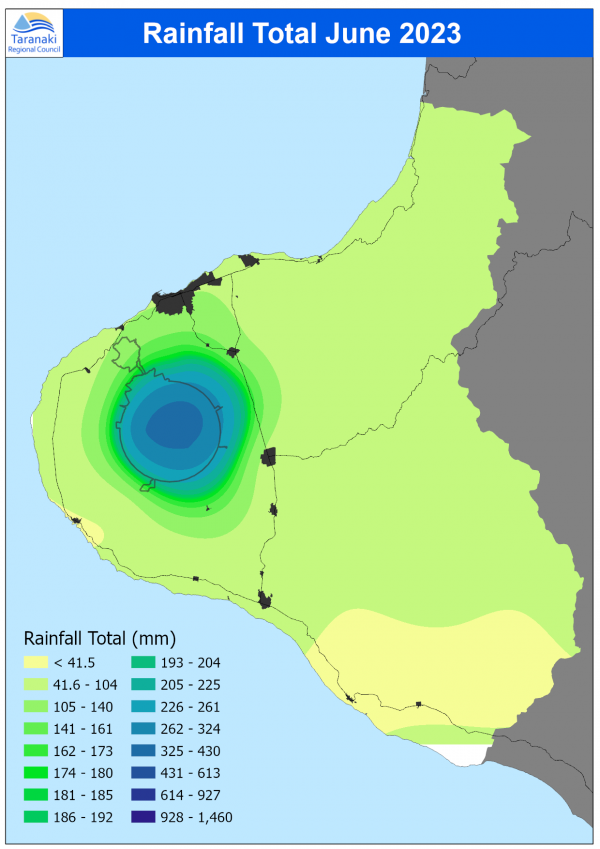
June bucked the trend for more than average monthly rainfall since the start of 2023 with an average of 74.9mm, or just 58% of the typical amount for the month.

This ranged from 80% less rainfall at Waitotara at Ngutuwera, and 37% less rainfall at Brooklands Zoo at New Plymouth than a typical June. Year to date rainfall ranges from 5% less rainfall at Uruti at Kaka Rd, and 45% more rainfall at Whanganui at Mataimona Trig, with an average of 16% more than normal.
Mean river flows for June were 41.6% lower than typical values, low flows were 21% greater, and high flows 58.2% lower than typical values while average river (non-mountain) water temperatures were 10.6°C, about the same as long-term June values.
The average air temperature for the region (excluding Te Maunga sites) was 10.3°C. June average wind speeds were 15 km/hr, with average gust strength of 40.6 km/hr, these were 1.4 km/hr lighter, and 4.7 km/hr weaker than the long-term average.
June 2023 rainfall maps
What you should know:
-
The site maps show data from a selection of the sites we monitor, but not all of them.
-
The distribution maps are based on mathematical modelling and may not accurately represent actual rainfall in some unmonitored areas.
Click on each map for larger version.
MONITORED SITES

RAINFALL DISTRIBUTION
