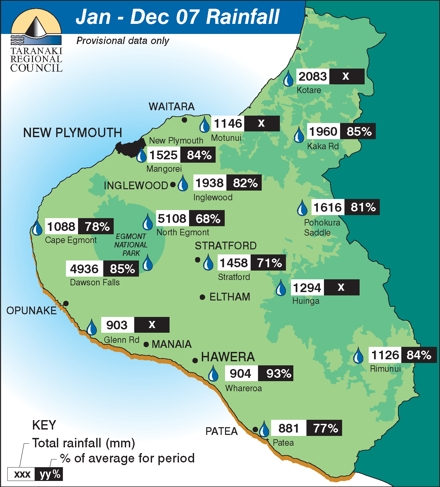
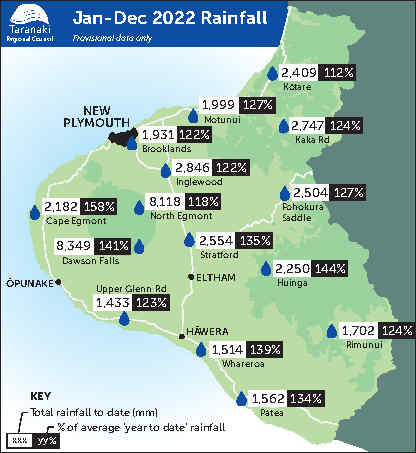
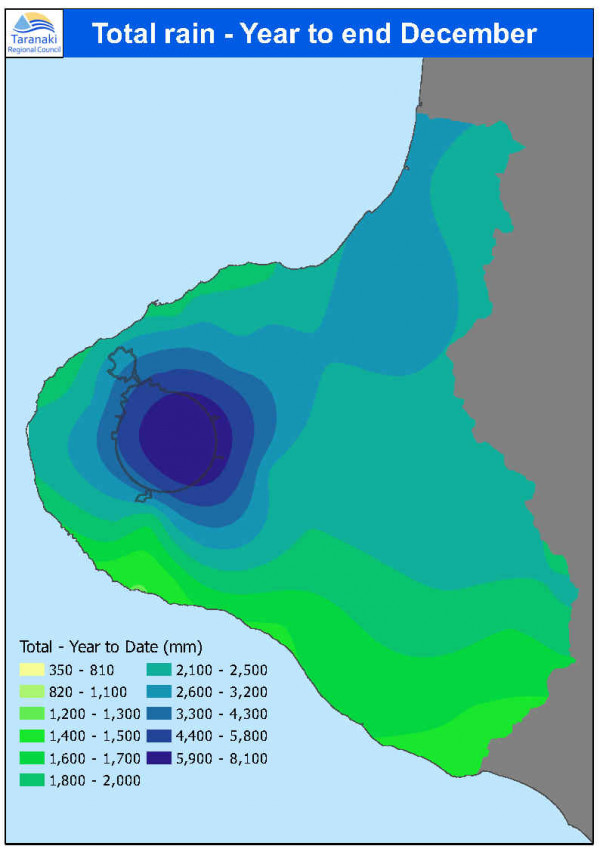
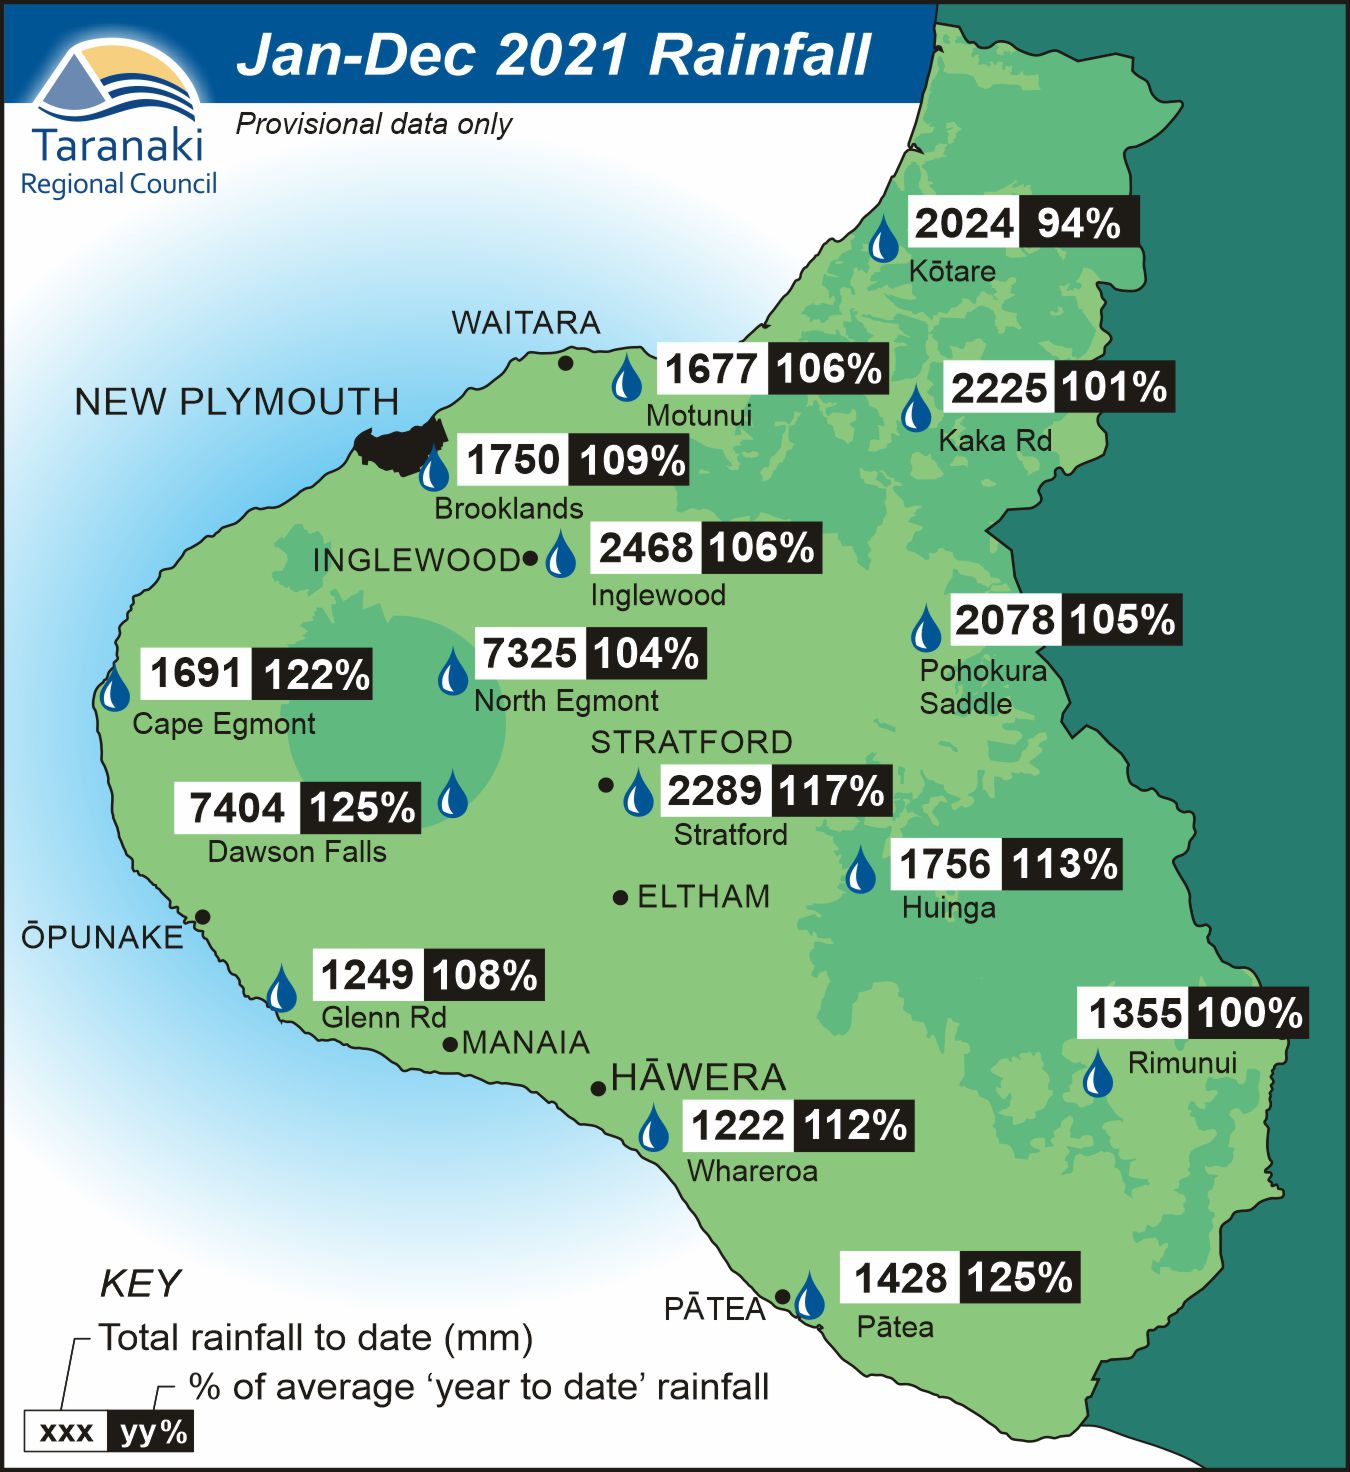
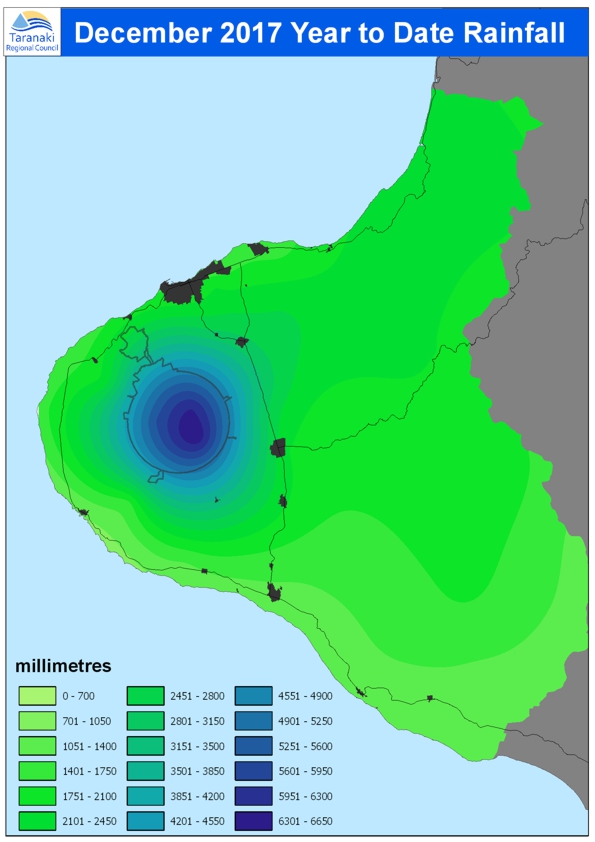
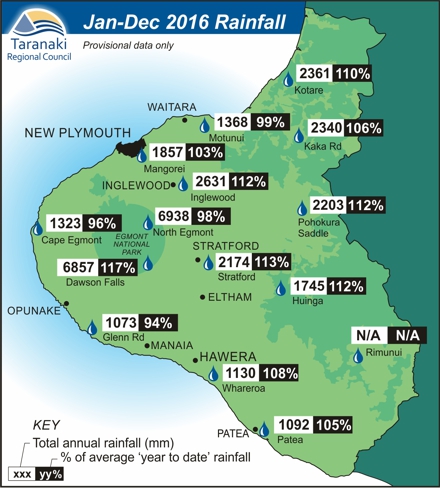
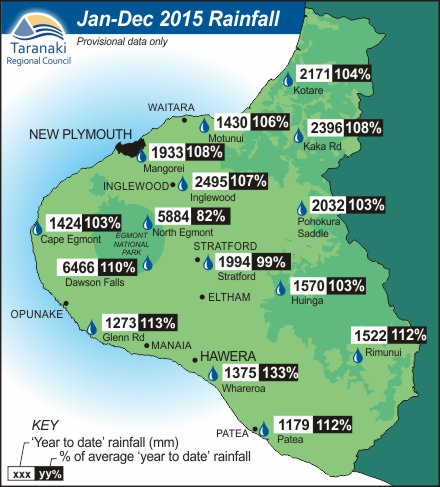
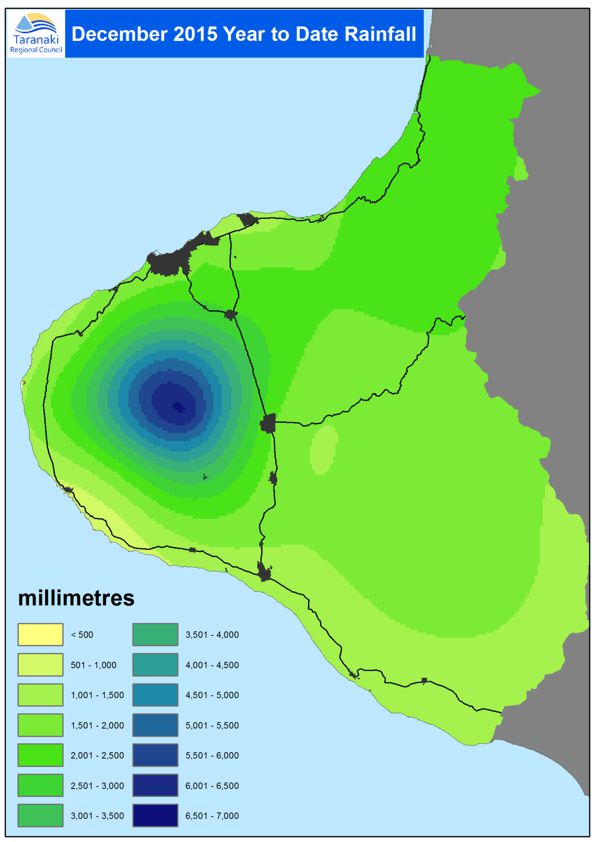
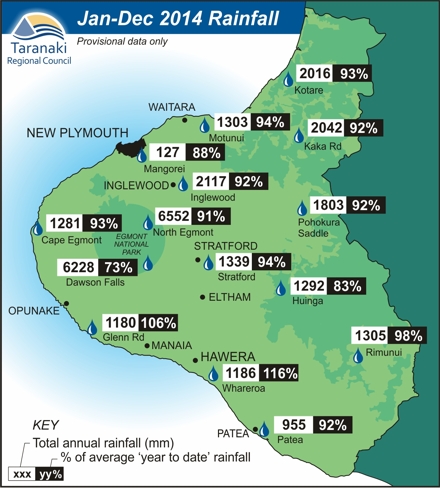
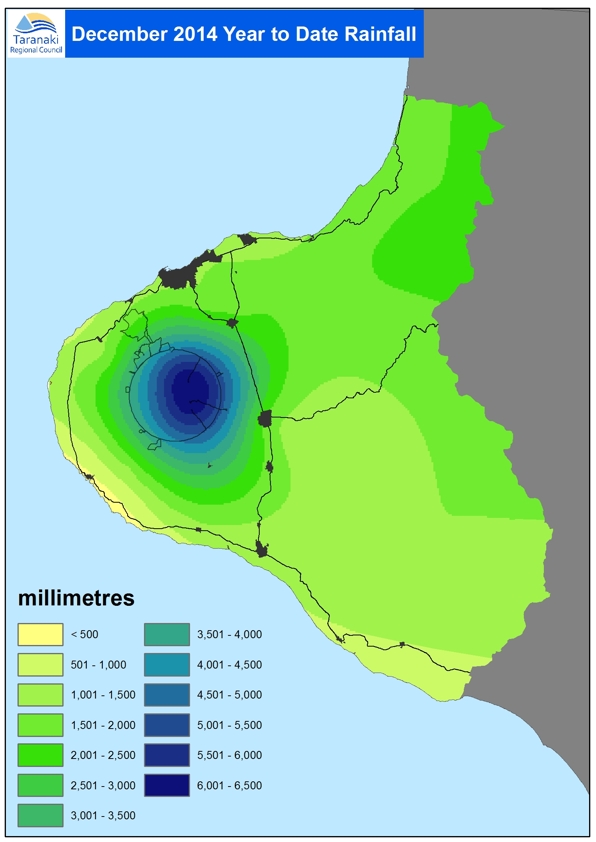
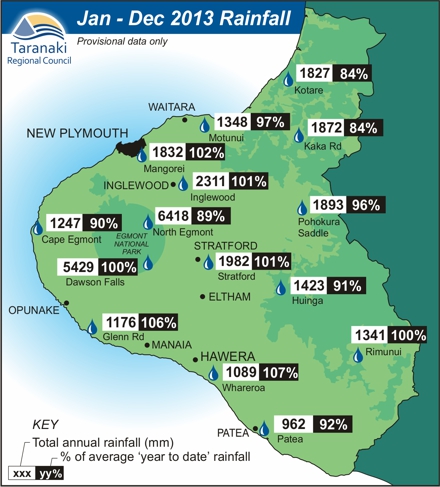
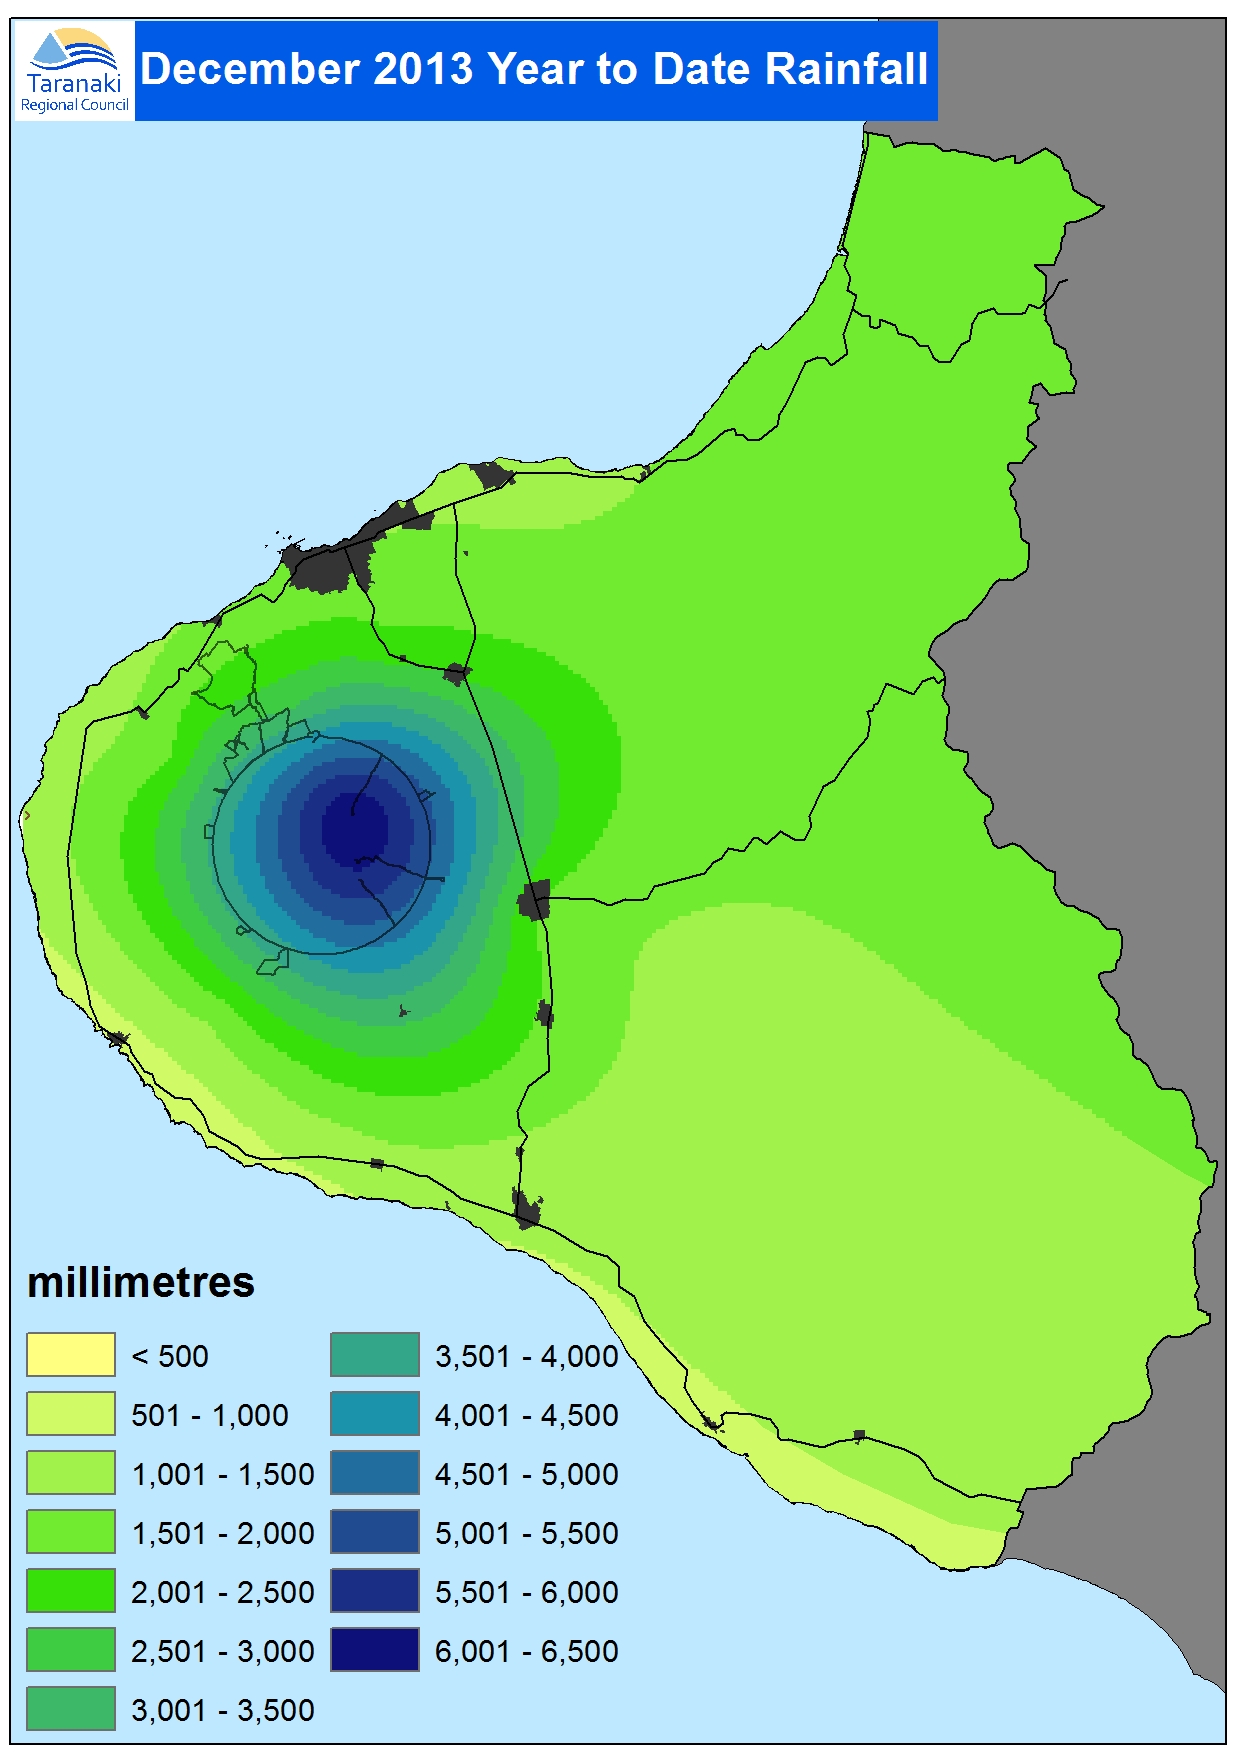
Maps showing annual rainfall at Taranaki sites going back to 2007, and annual rainfall distribution since 2010.
What you should know:
♦ The site maps show data from a selection of the sites we monitor, but not all of them.
♦ The distribution maps are based on mathematical modelling and may not accurately represent actual rainfall in some unmonitored areas.
♦ Distribution maps have been available only since 2010.
Click on maps to see large versions
Rainfall in 2022.
2022 rainfall maps [PDF, 738 KB]
MONITORED SITES
RAINFALL DISTRIBUTION
Rainfall in 2021
2021 rainfall maps [PDF, 632 KB]
MONITORED SITES
RAINFALL DISTRIBUTION
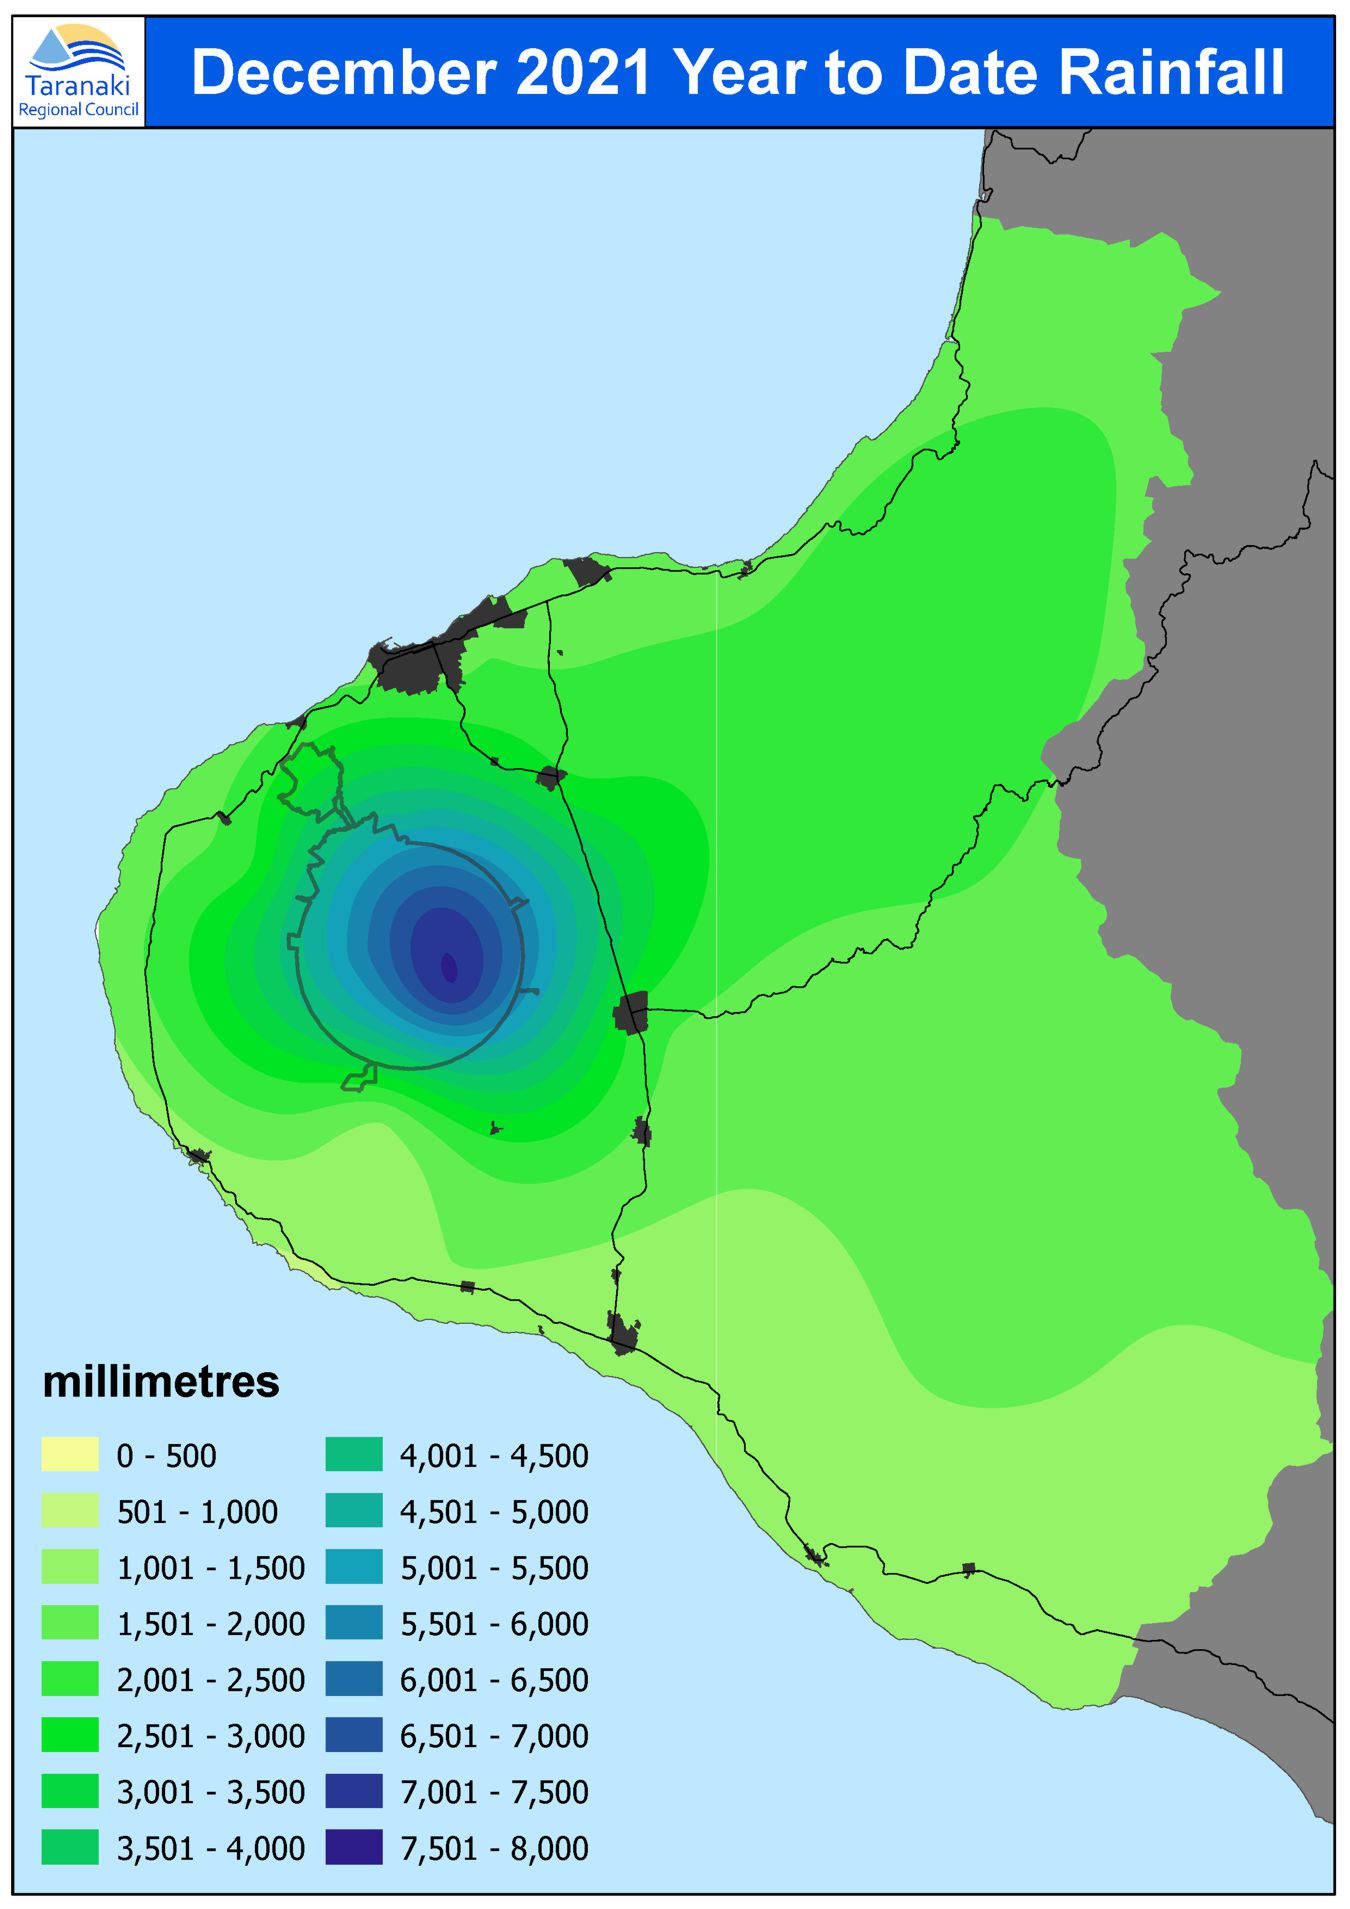
Rainfall in 2020
2020 rainfall maps [PDF, 524 KB]
MONITORED SITES
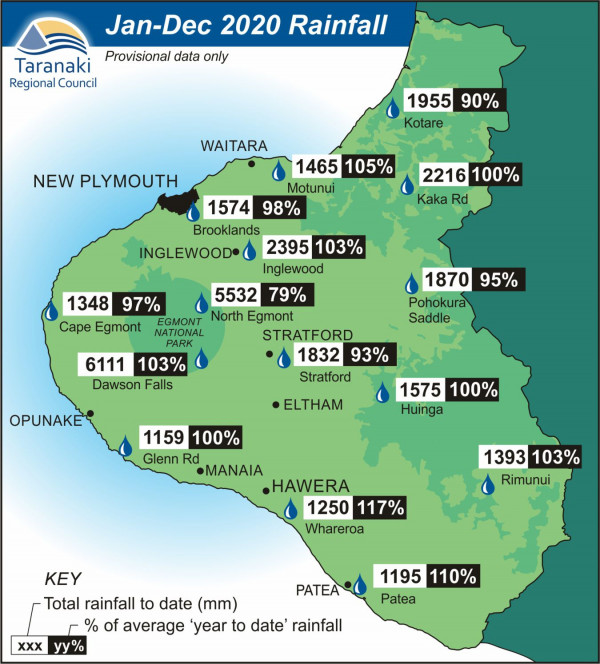
RAINFALL DISTRIBUTION
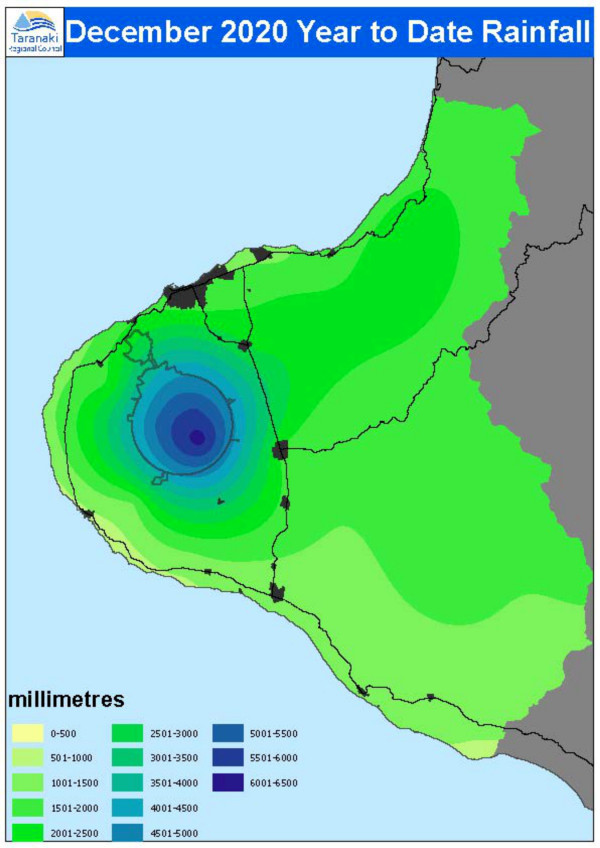
Rainfall in 2019
2019 rainfall maps [PDF, 439 KB]
MONITORED SITES
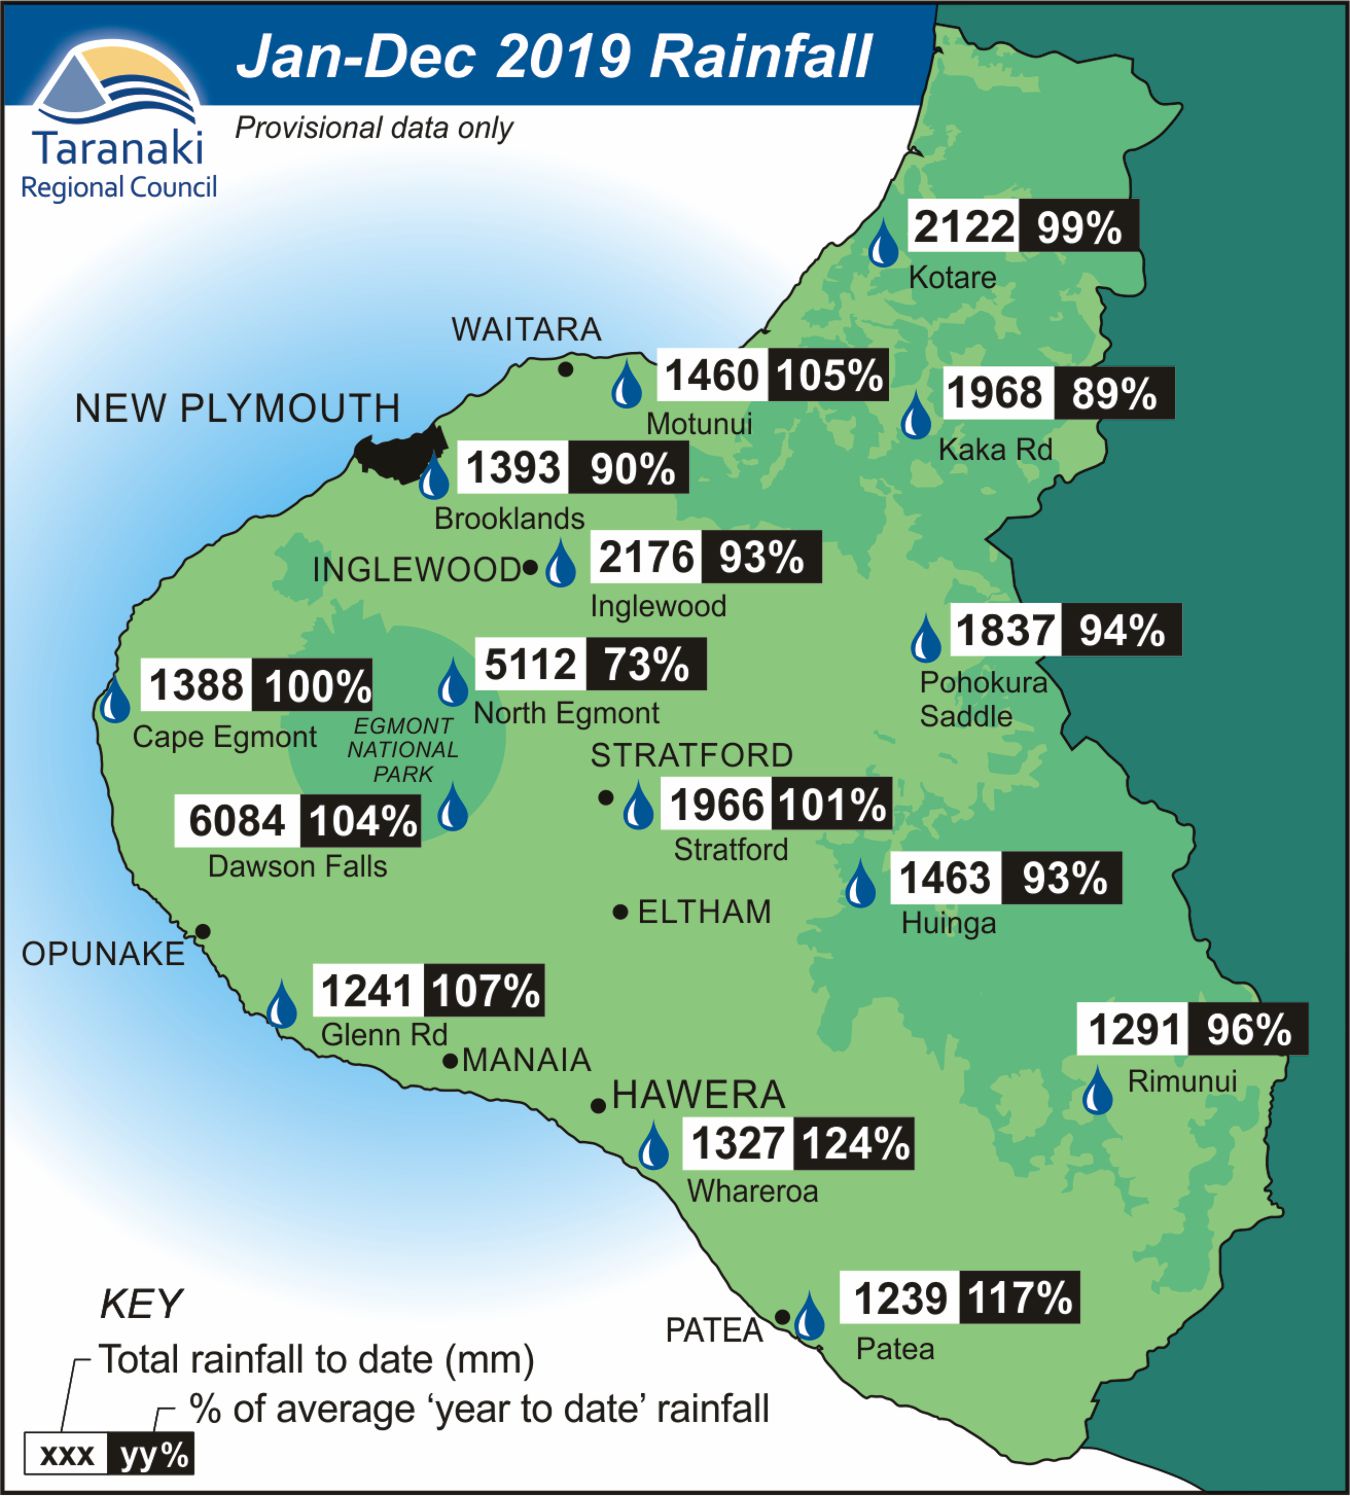
RAINFALL DISTRIBUTION
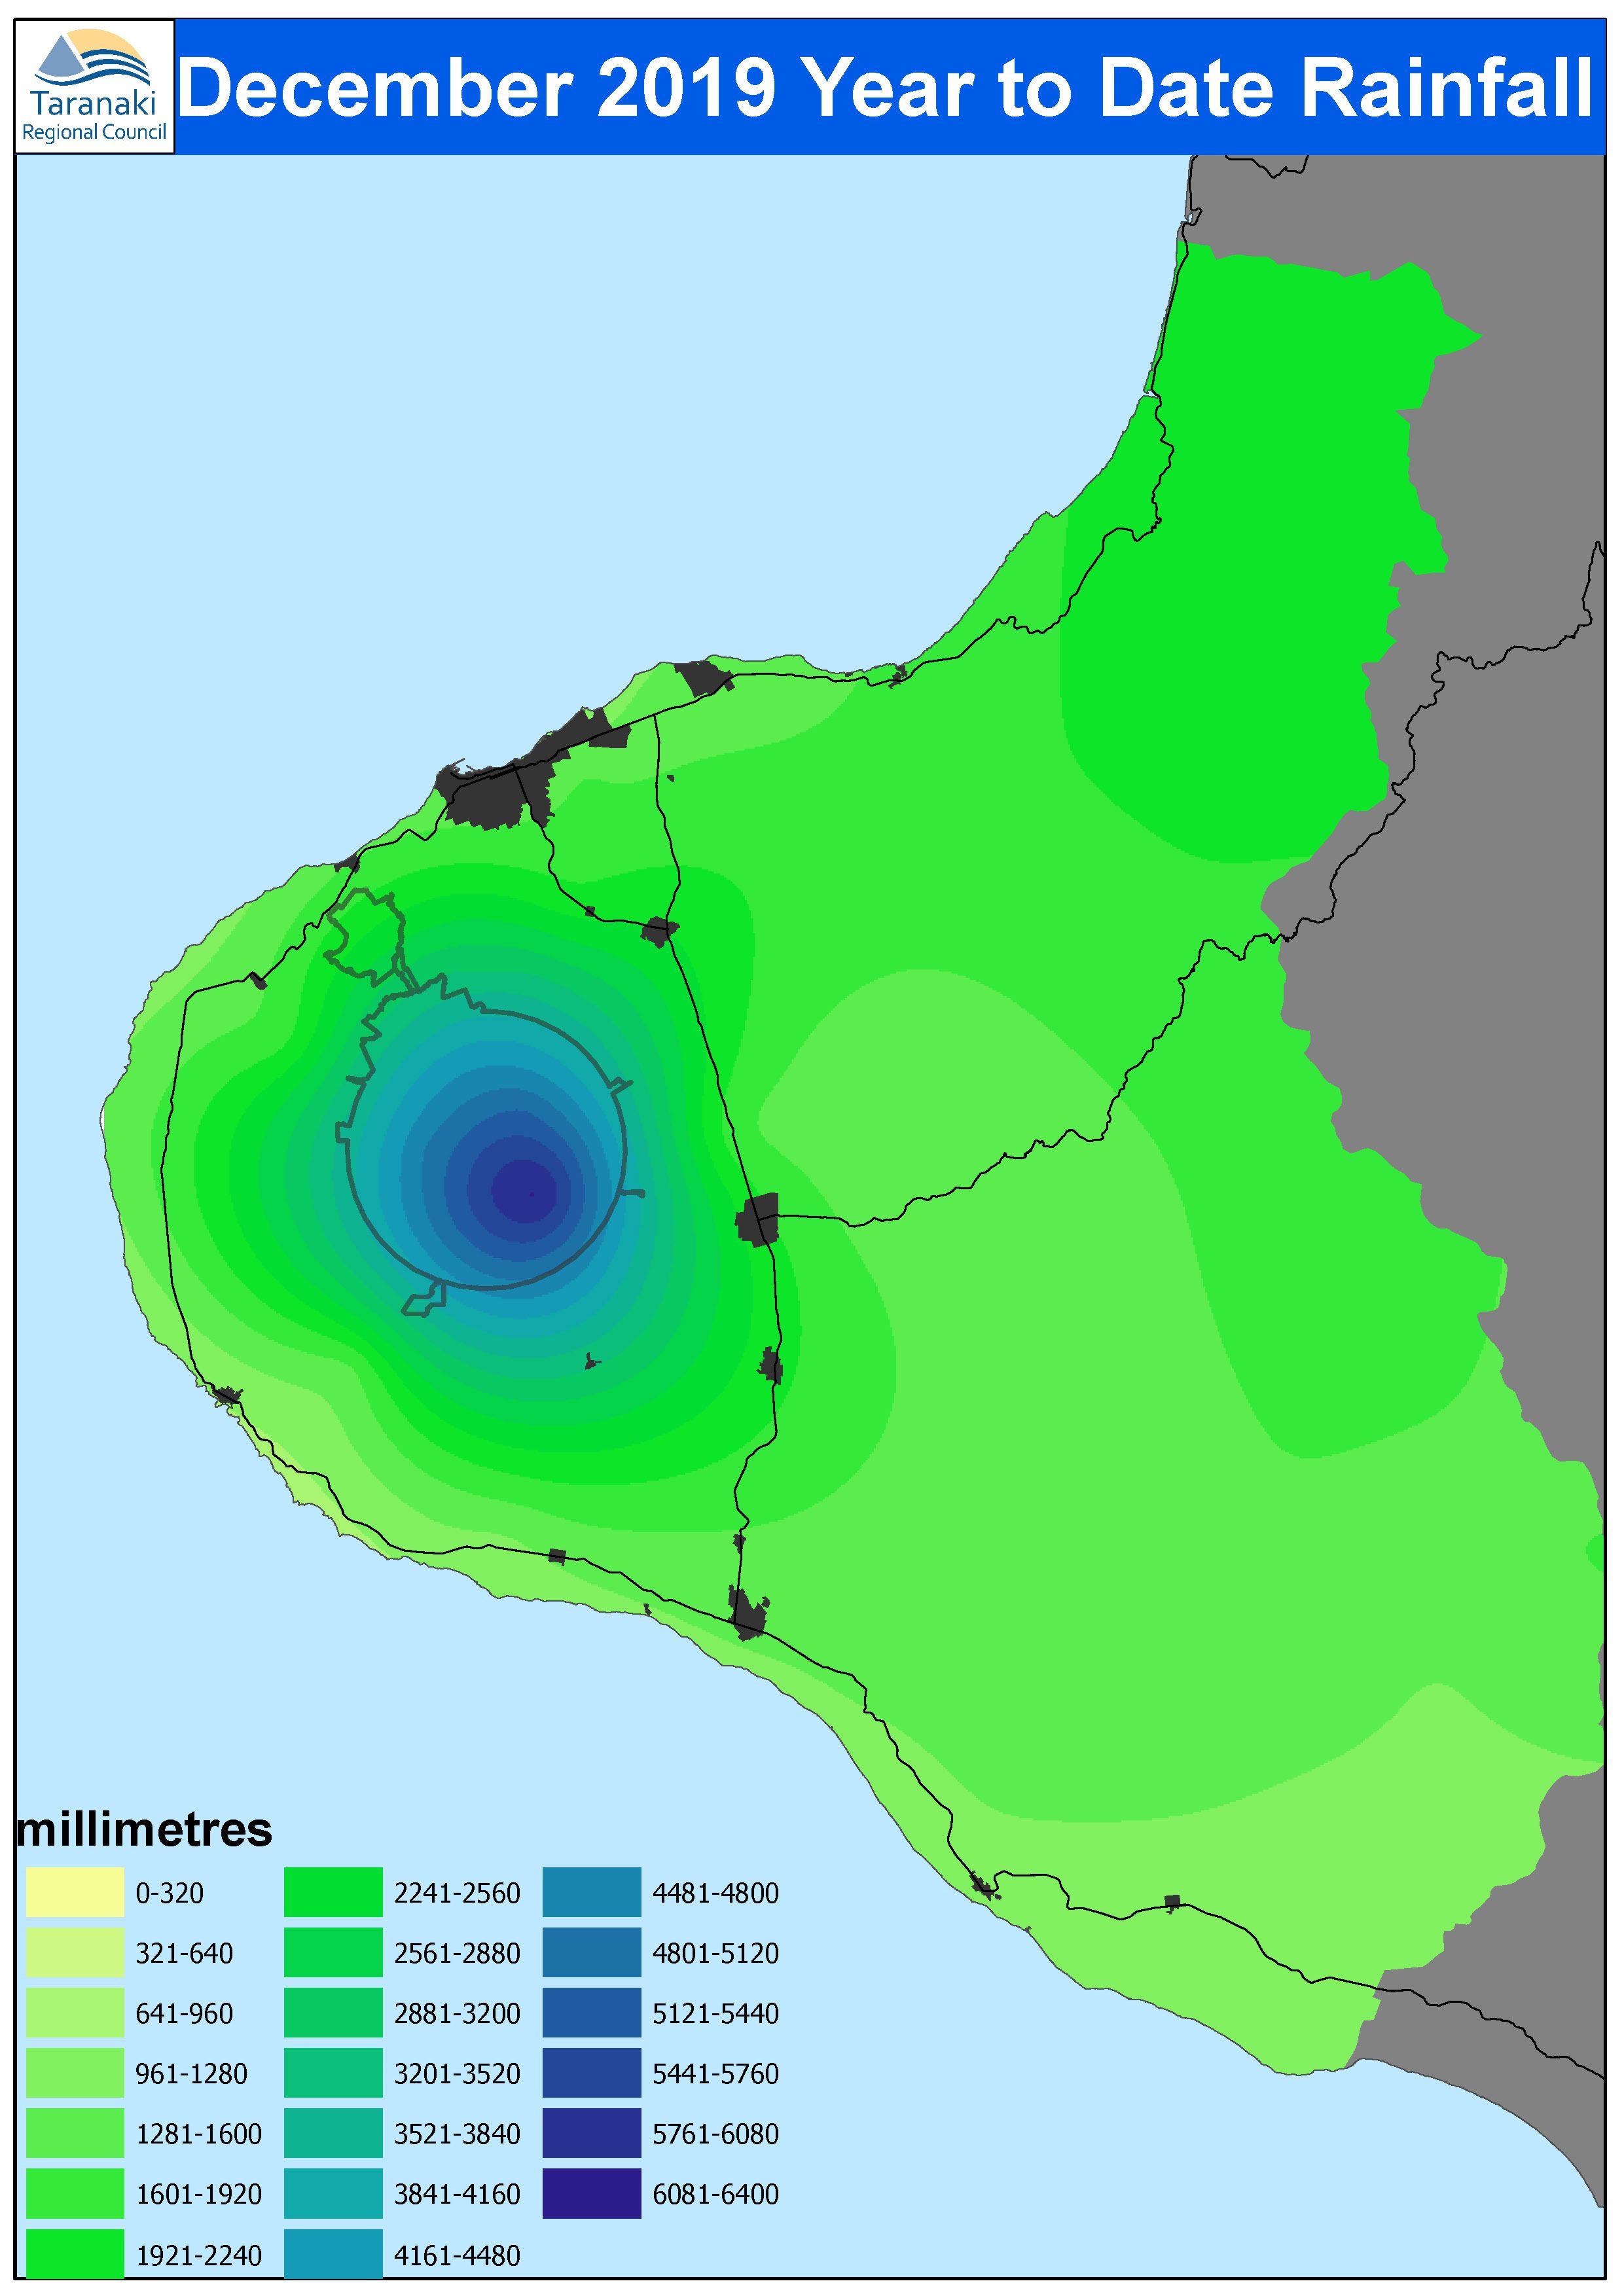
Rainfall in 2018
2018 rainfall maps [PDF, 189 KB]
MONITORED SITES
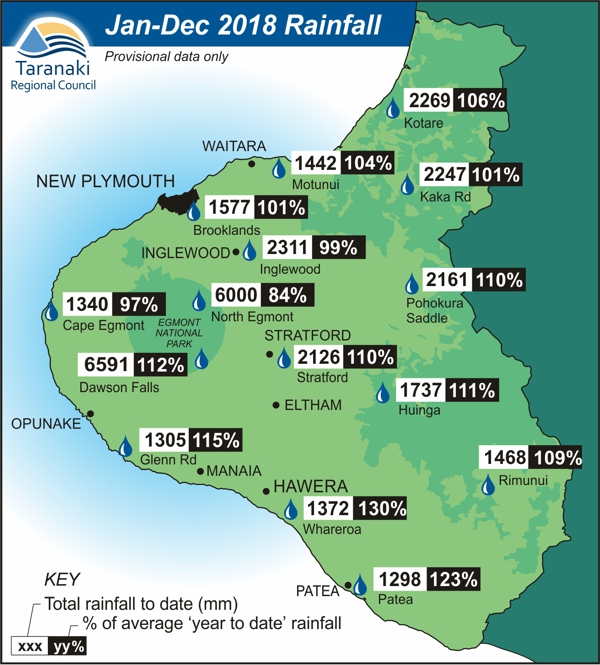
RAINFALL DISTRIBUTION
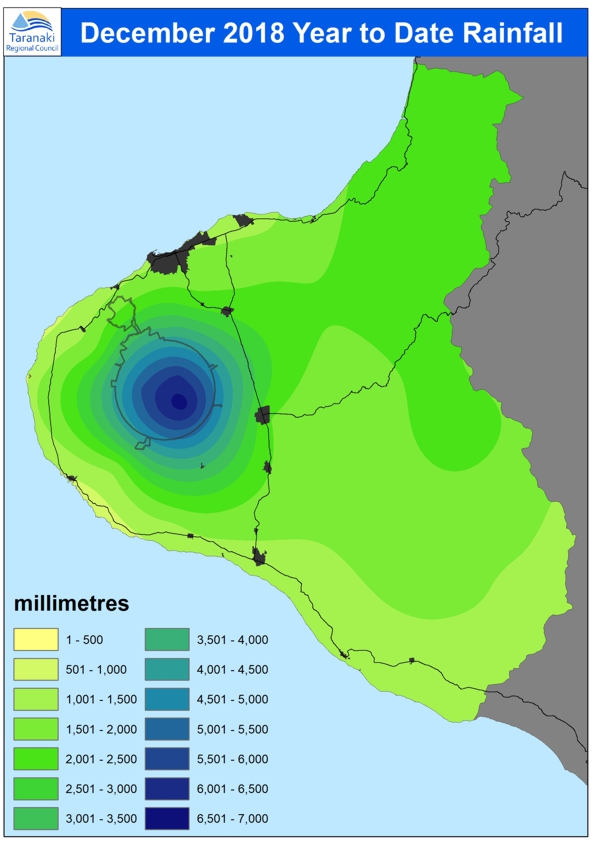
Rainfall in 2017
2017 rainfall maps [PDF, 316 KB]
MONITORED SITES
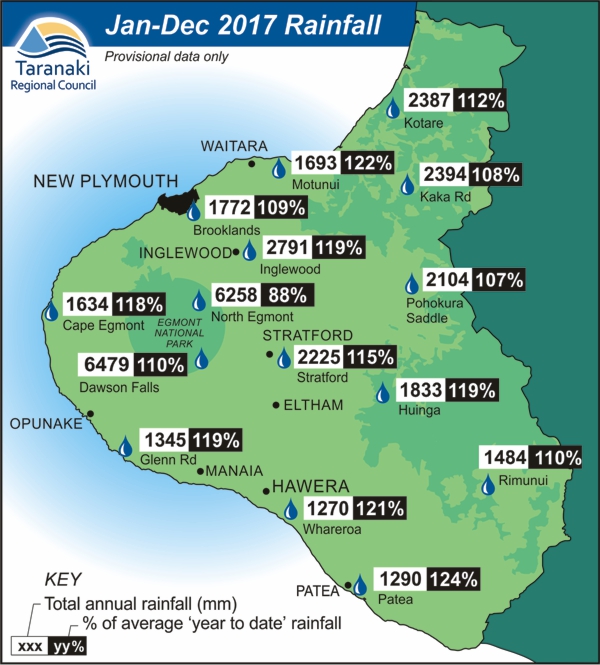
RAINFALL DISTRIBUTION
Rainfall in 2016
2016 rainfall maps [PDF, 438 KB]
MONITORED SITES
RAINFALL DISTRIBUTION

Rainfall in 2015
2015 rainfall maps [PDF, 219 KB]
MONITORED SITES
RAINFALL DISTRIBUTION
Rainfall in 2014
2014 rainfall maps [PDF, 332 KB]
MONITORED SITES
RAINFALL DISTRIBUTION
Rainfall in 2013
2013 rainfall maps [PDF, 730 KB]
MONITORED SITES
RAINFALL DISTRIBUTION
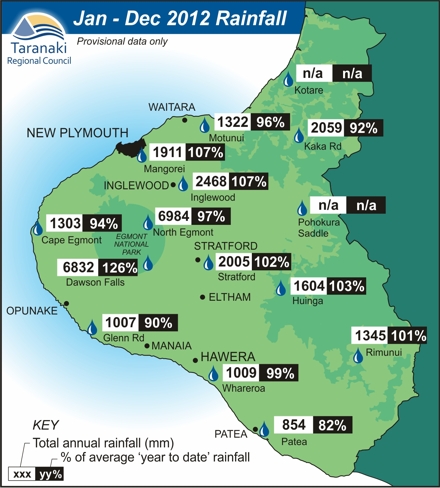
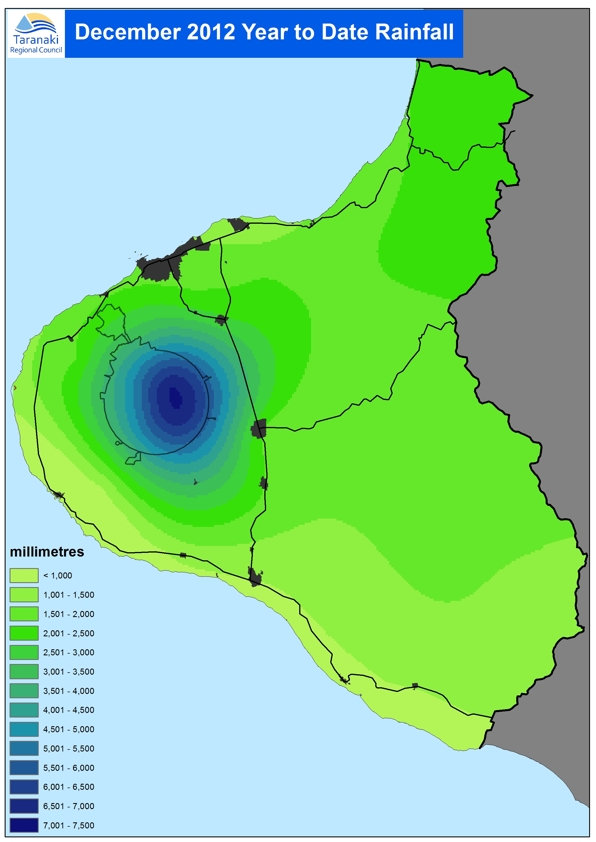
Rainfall in 2012
2012 rainfall maps [PDF, 339 KB]
MONITORED SITES
RAINFALL DISTRIBUTION
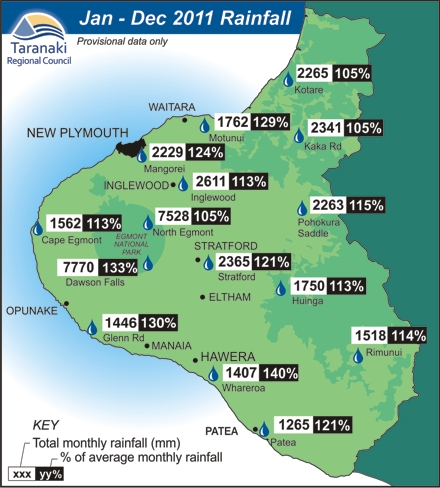
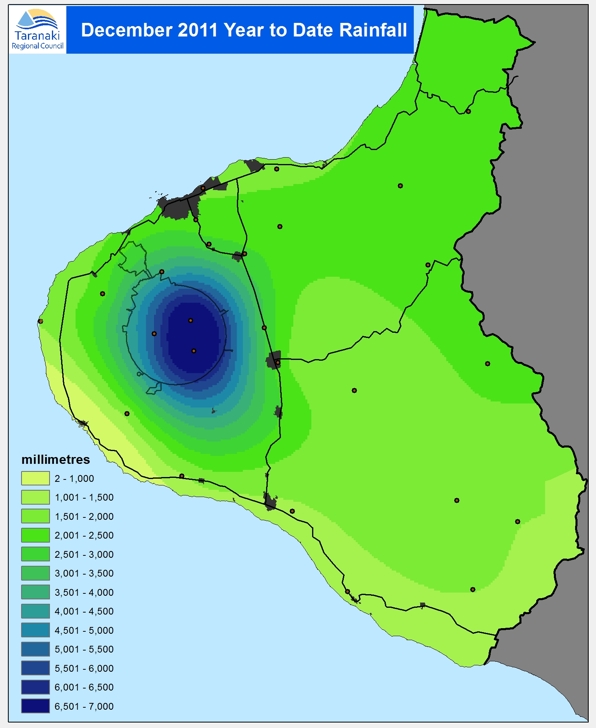
Rainfall in 2011
2011 rainfall maps [PDF, 339 KB]
MONITORED SITES
RAINFALL DISTRIBUTION
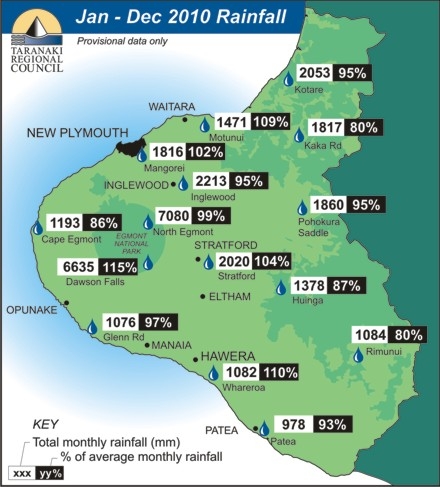
Rainfall in 2010
2010 rainfall maps [PDF, 164 KB]
MONITORED SITES
RAINFALL DISTRIBUTION
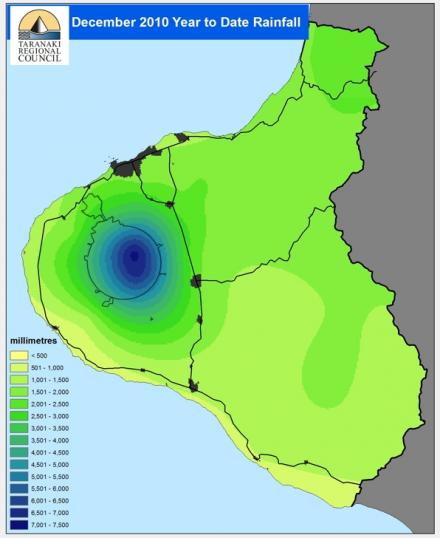
Rainfall in 2009
2009 rainfall map [PDF, 40 KB]
MONITORED SITES
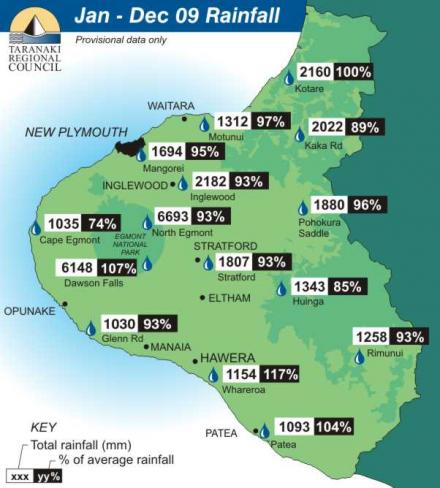
Rainfall in 2008
2008 rainfall map [PDF, 225 KB]
MONITORED SITES
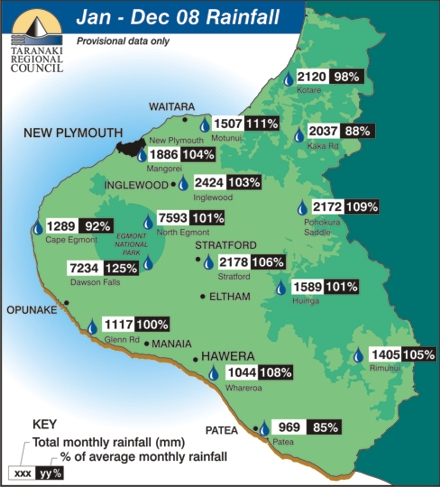
Rainfall in 2007
2007 rainfall map [PDF, 152 KB]
MONITORED SITES
