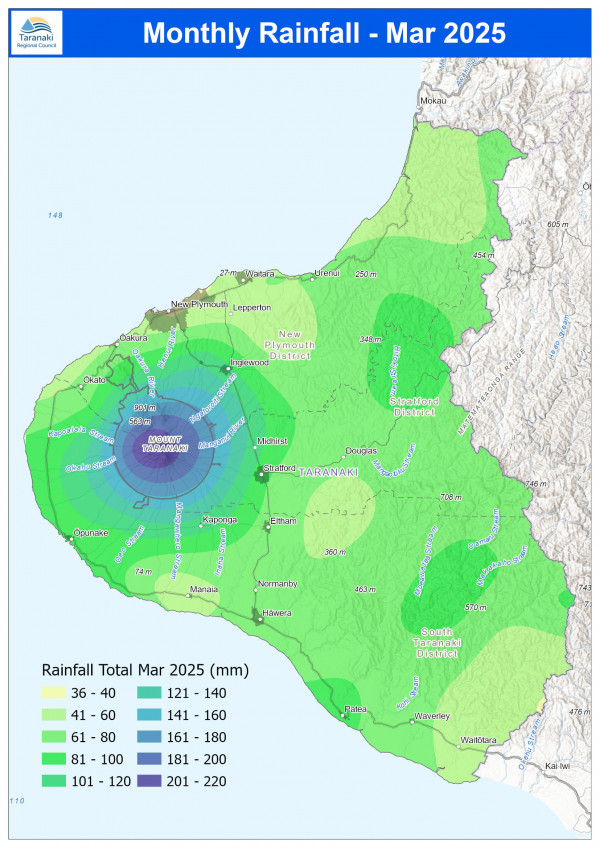
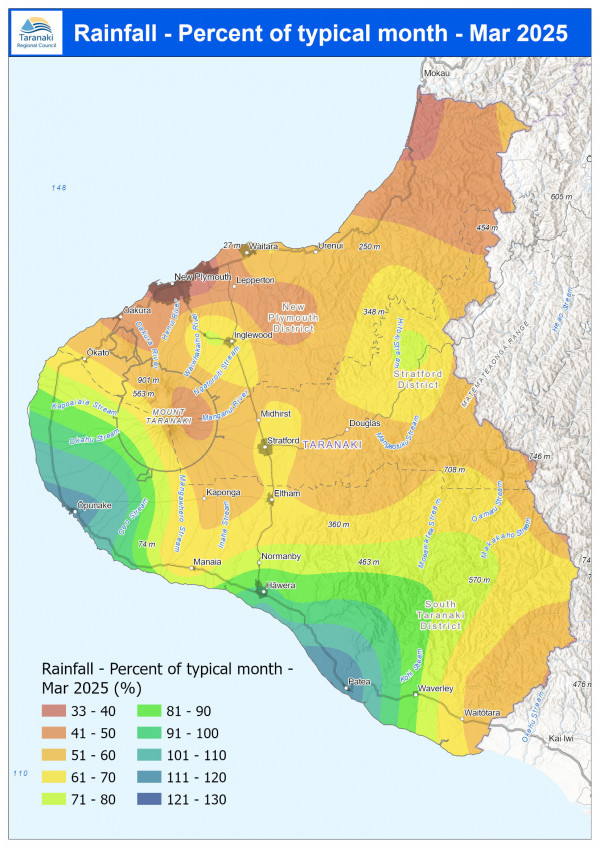
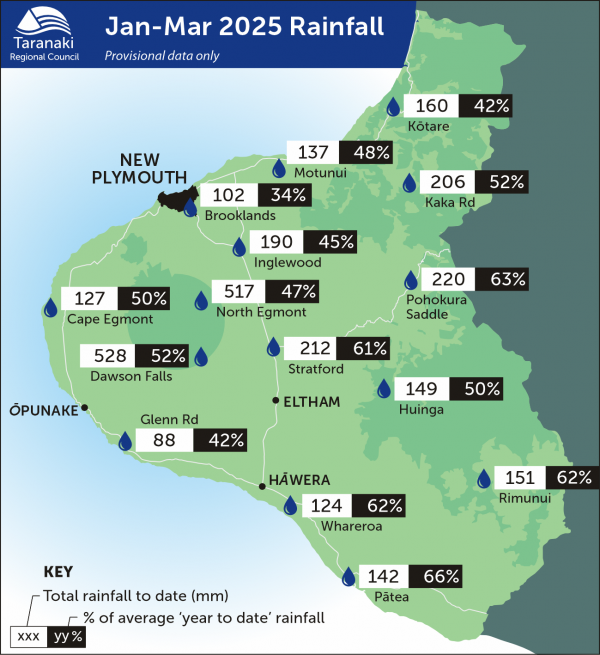
The dry conditions Taranaki has experienced in 2025 continued in March with an average rainfall of 153.6mm - that’s 31% less than usual.
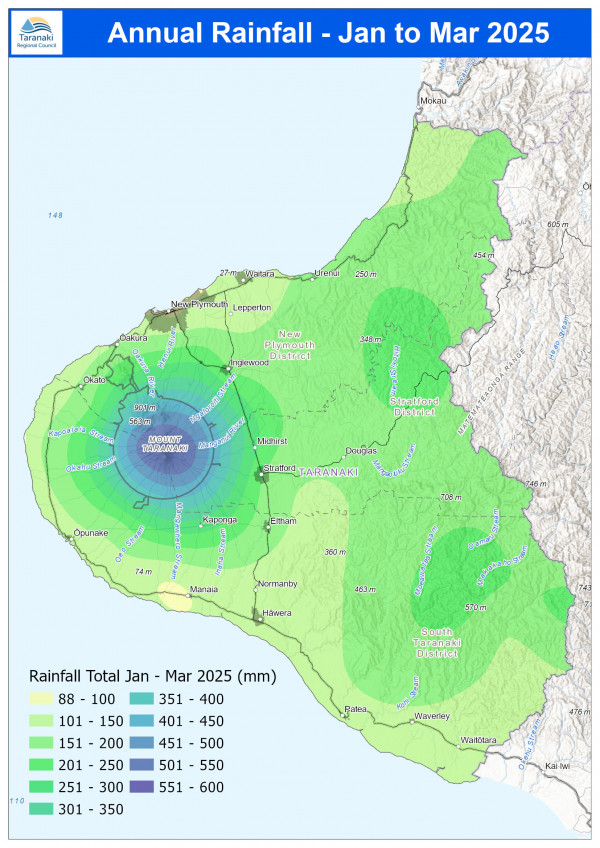
This ranged from 66% less at Brooklands Zoo in New Plymouth, and 19% more at Pātea at Bore 3. Brooklands Zoo also has the lowest year-to-date rainfall – also at 66% less than usual – while Omahine at Moana Trig has had the highest year to date rainfall with 30% less. On average there has been 47% less than normal across all rain gauges.
Mean river flows for March were 48% lower than typical values, low flows were 10.9% lower, and high flows 73% lower than typical values while mean river (non-mountain) water temperatures were 16.5°C, an average of 0.3°C warmer than long-term March values.
Mean river (non-mountain) water temperatures were 16.5°C, an average of 0.3°C warmer than long-term March values.
The average air temperature for the region (excluding Te Maunga sites) was 16.1°C, which is 0.1°C cooler than long-term March averages. The maximum air temperature recorded in March was 31°C at Inglewood at Oxidation Ponds on 10 March.
March average wind speeds were 12.6km/hr, with average gust strength of 37.4km/hr, these were 0.2km/hr lighter, and 1.5km/hr weaker than the long-term average. The maximum wind gust recorded in March was 83.3km/hr at Hawera AWS on 5 March.
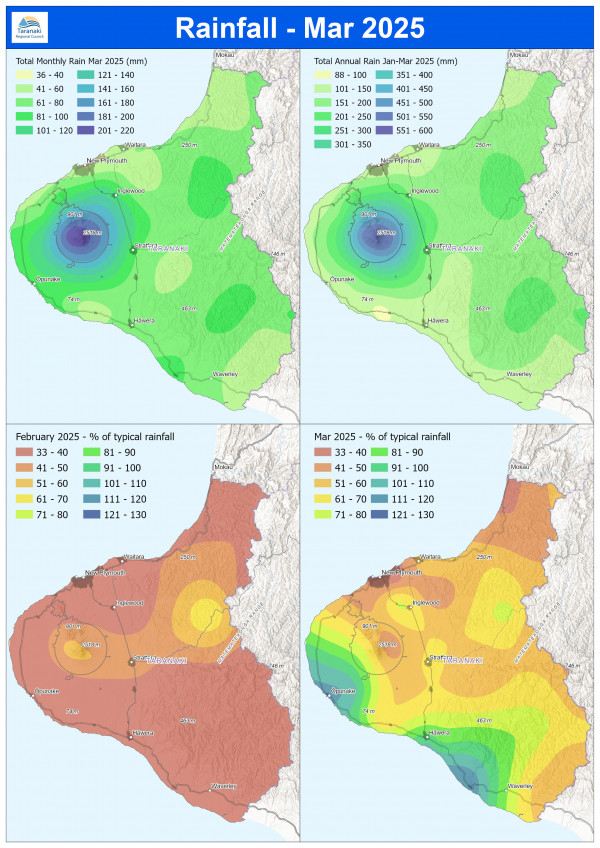
March 2025 rainfall maps
What you should know:
- The site maps show data from a selection of the sites we monitor, but not all of them.
- The distribution maps are based on mathematical modelling and may not accurately represent actual rainfall in some unmonitored areas.
- This is raw data and may not have been subjected to a quality control process. All efforts are made to ensure the integrity of the data, but the Council cannot guarantee its accuracy, or its suitability for any purpose. See the full terms and conditions for the use of environmental data(external link).
MONITORED SITES

RAINFALL DISTRIBUTION